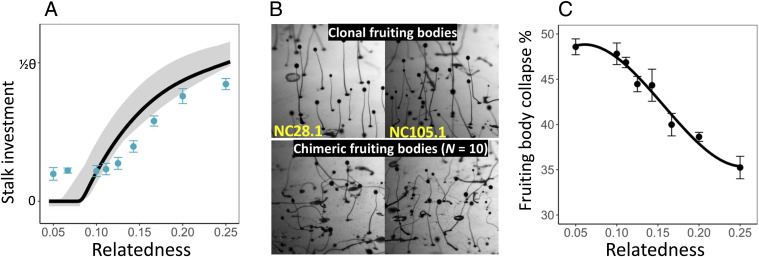
Fig. 3.
The pattern of collective stalk investment and associated fruiting body stability as a function of relatedness. All N strains in a group have equal relatedness (= 1/N). (A) Stalk investment inferred from the number of spores produced by groups with different compositions relative to that expected when clonal. Points and error bars represent means ± one SE from replicated experiments (average n = 22 per group) using different combinations of naturally cooccurring strains. The solid line is the pattern predicted using the best-fit model parameters from three-strain groups and the gray shaded area the 95% confidence interval. Empirical estimates of stalk investment are scaled so that they represent proportions of the model predicted optimal level of investment (θ). (B) Representative images of fruiting bodies from clonal development and from low relatedness mixes (for mixes of 10 strains at equal frequency). Images are of aggregations generated for the smFISH experiment (and so do not directly correspond to the ones measured in A or B). (C) The proportion of fruiting bodies that spontaneously collapsed (after 48 h) as a function of the relatedness of strains within a group. Individual points and error bars are means ± SE from replicates (average n = 11.25 per group) using different groupings of natural strains. The solid line is included for visualization and was fitted by polynomial regression using relatedness cubed.

