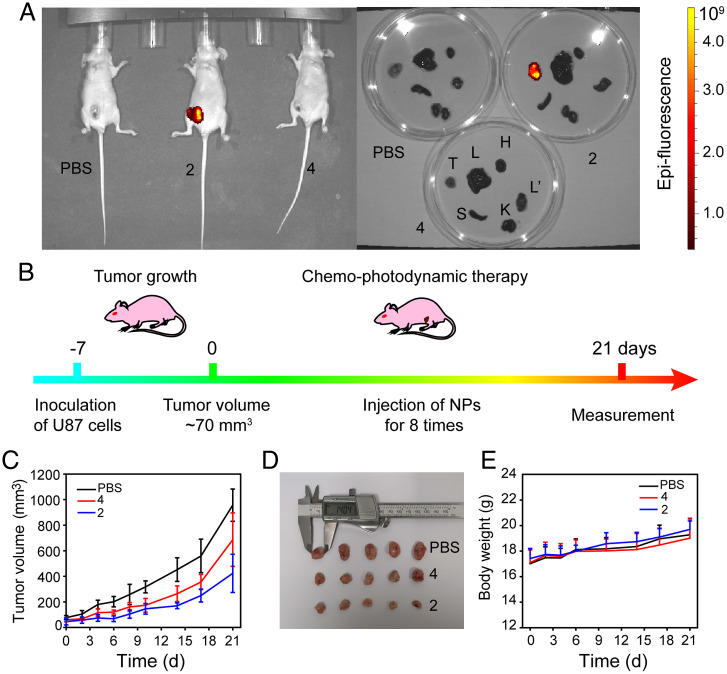
Fig. 5.
(A) In vivo and ex vivo fluorescence images of the mice and their major organs at 24 h after the last injection (H: heart; L: liver; S: spleen; L': lung; K: kidney; T: tumor). (B) Protocol of tumor therapy in mice inoculated with glioblastoma cells (U87); Variations in the (C) tumor volume and (D) body weight of mice during therapy; PBS, phosphate-buffered saline (control group); (E) gross appearance of the excised tumors at the end of the 21-d treatment period.

