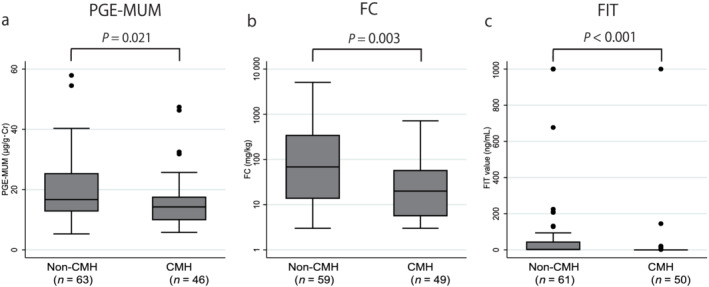
Figure 3.

Comparison of the prostaglandin E‐major urinary metabolite (PGE‐MUM), fecal calprotectin (FC), and fecal immunochemical test (FIT) values between the complete mucosal healing (CMH) and non‐CMH groups. The PGE‐MUM, FC, and FIT values were significantly lower in the CMH group than those in the non‐CMH group. [Color figure can be viewed at wileyonlinelibrary.com]
