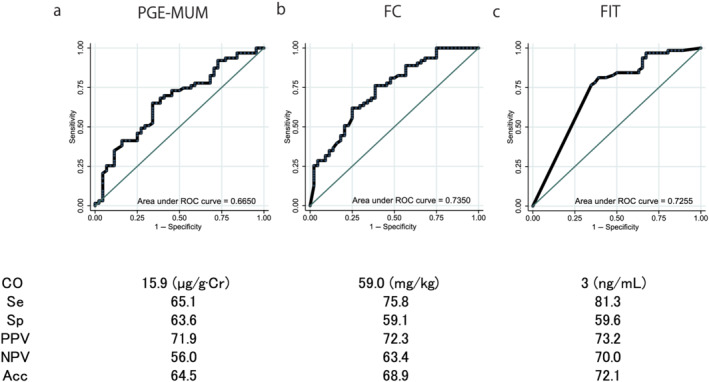
Figure 5.

Comparison of the area under the curve of the receiver operating characteristic (ROC) curves, the optimal cut‐off (CO) values, the sensitivity (Se), specificity (Sp), positive predictive value (PPV), negative predictive value (NPV), and the accuracy (Acc) of the three biomarkers for the determination of histological remission: (a) prostaglandin E‐major urinary metabolite (PGE‐MUM), (b) fecal calprotectin (FC), and (c) fecal immunochemical test (FIT) values. The area under the curve of the ROC curves did not differ based on the type of exam conducted. [Color figure can be viewed at wileyonlinelibrary.com]
