
FIGURE 2.
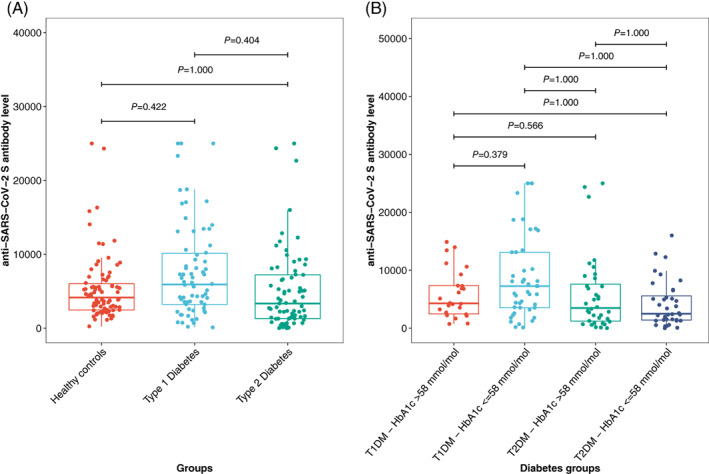
A, Comparison of anti‐SARS‐CoV‐2‐S antibodies between participants with diabetes and healthy controls after the second vaccination. B, Comparison of anti‐SARS‐CoV‐2‐S antibodies in people with type 1 (T1DM) and type 2 diabetes (T2DM) and a glycated haemoglobin (HbA1c) level of ≤58 mmol/mol or >58 mmol/mol, respectively. P values are adjusted for age and sex using quantile regression and for multiple comparison using Bonferroni correction