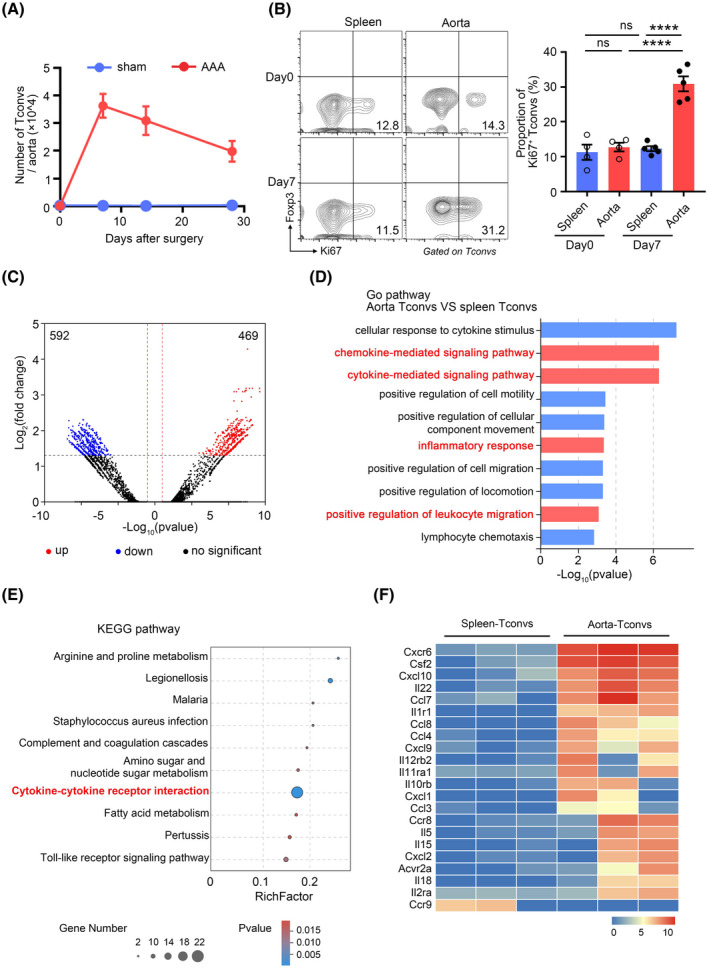
FIGURE 1.

Tconvs infiltrate aortic aneurysms and exhibit a different transcriptome than the splenic Tconvs. (A) The numbers of Tconvs in the aortic aneurysms at day 0, day 7, day 14, and day 28 after abdominal aortic aneurysms (AAA) or sham operation. n = 4–5 per group. (B) Representative flow cytometry plots (left) and quantification (right) of Ki67 expression by Tconvs in aortic aneurysms and spleens 7 days after AAA. n = 4–5 per group. ****p < .0001 according to one‐way ANOVA. (C) RNA‐seq volcano plot of differential gene expression between Tconvs in aortic aneurysms and spleens. (D) The bar plot presents the enrichment scores (−Log10(p value)) of the top 10 significantly enriched Gene Ontology terms. (E) Top 10 enrichment scores of KEGG pathway enrichment analysis. The rich factor represents the degree of enrichment of the differentially expressed genes. The p‐value is represented by a color scale. (F) Heat map of the indicated gene (KEGG Term “Cytokine–cytokine receptor interaction” [KEGG: mmu04060]) expression of Tconvs in aortic aneurysms and spleens
