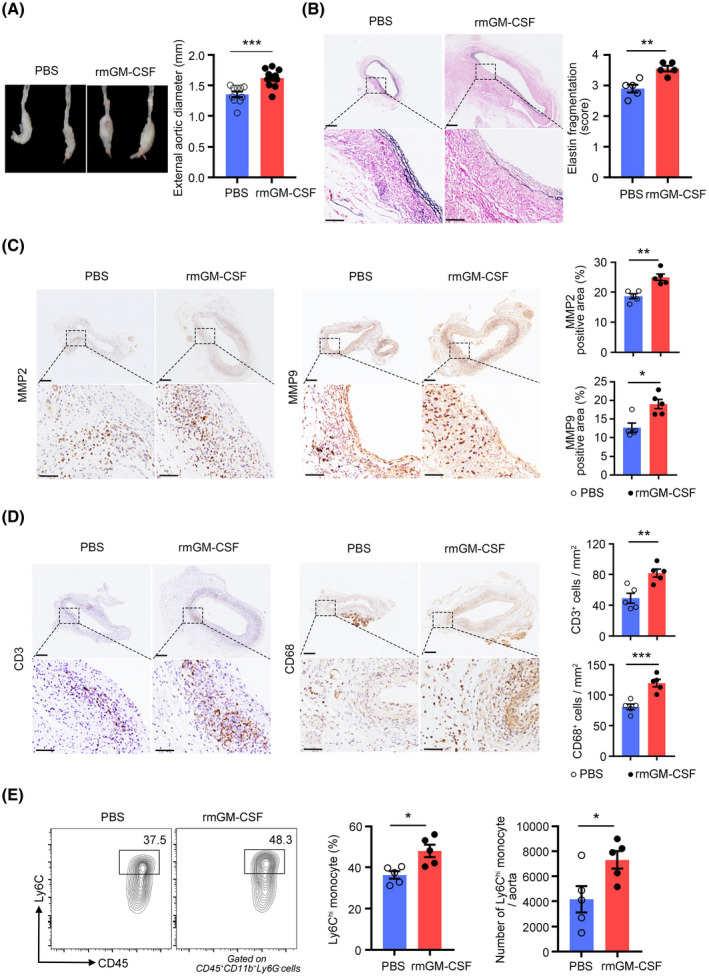
FIGURE 5.

Granulocyte‐macrophage colony‐stimulating factor (GM‐CSF) treatment exacerbates porcine pancreatic elastase (PPE)–induced abdominal aortic aneurysm (AAA) development. (A) AAA was induced in mice by PPE, and the mice were intraperitoneally injected with rmGM‐CSF or PBS. Representative images of abdominal aortic fragments (left) and quantification of maximal diameters (right). n = 10–11 per group. ***p < .001 according to unpaired two‐tailed t test. (B) Representative photomicrographs (left) and quantification (right) of elastin layers in the aortic wall by elastic Verhoeff‐Van Gieson staining at day 14, scale bar = 200 µm for whole aortic sections; scale bar = 50 µm for magnified areas. n = 5 per group. **p < .01 according to unpaired two‐tailed t test. (C) Representative photomicrographs (left) and quantification (right) of MMP2 and MMP9‐positive areas in the aorta at day 14, scale bar = 200 µm for whole aortic sections; scale bar = 50 µm for magnified areas. n = 5 per group. **p < .01 according to unpaired two‐tailed t test for MMP2 and Mann–Whitney test for MMP9. (D) Representative photomicrographs (left) and quantification (right) of CD3‐positive T cells and CD68‐positive macrophages in the aorta at day 14, scale bar = 200 µm for whole aortic sections; scale bar = 50 µm for magnified areas. n = 5 per group. **p < .01, ***p < .001 according to unpaired two‐tailed t test. (E) Representative flow cytometry images (left) and quantification (right) of Ly6Chi monocytes in aortic aneurysms at day 7. n = 5 per group. *p < .05 according to unpaired two‐tailed t test
