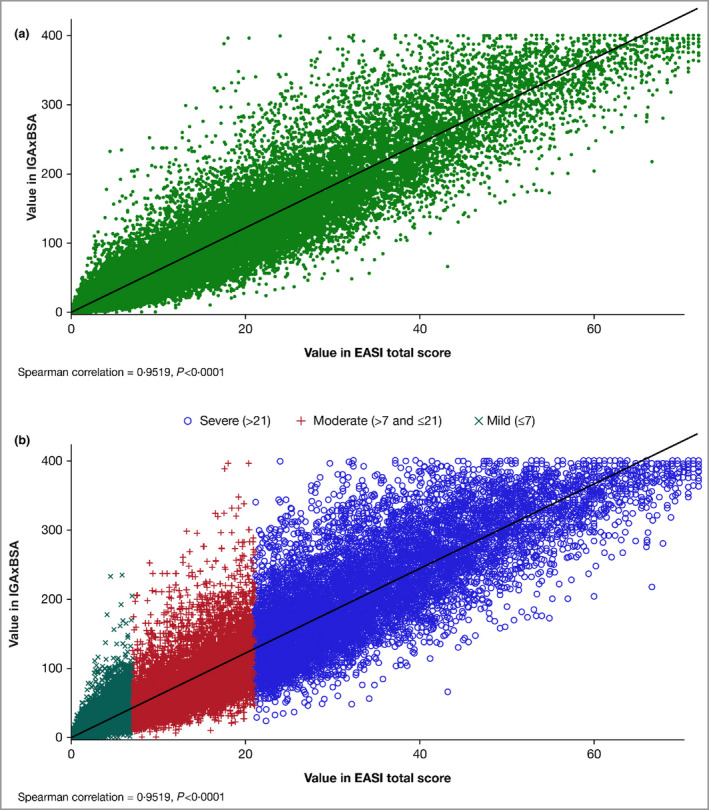
Figure 1.

(a) Scatter plot of the correlation of disease severity metrics IGAxBSA vs. Eczema Area and Severity Index (EASI), all patients pooled (n = 36 657). Spearman correlation = 0·95, P < 0·0001. (b) Scatter plot of the correlation of disease severity metrics IGAxBSA vs. EASI by severity, all patients pooled (n = 36 657). Spearman correlation = 0·95, P < 0·0001. BSA, body surface area; IGA, Investigator’s Global Assessment.
