Figure 2.

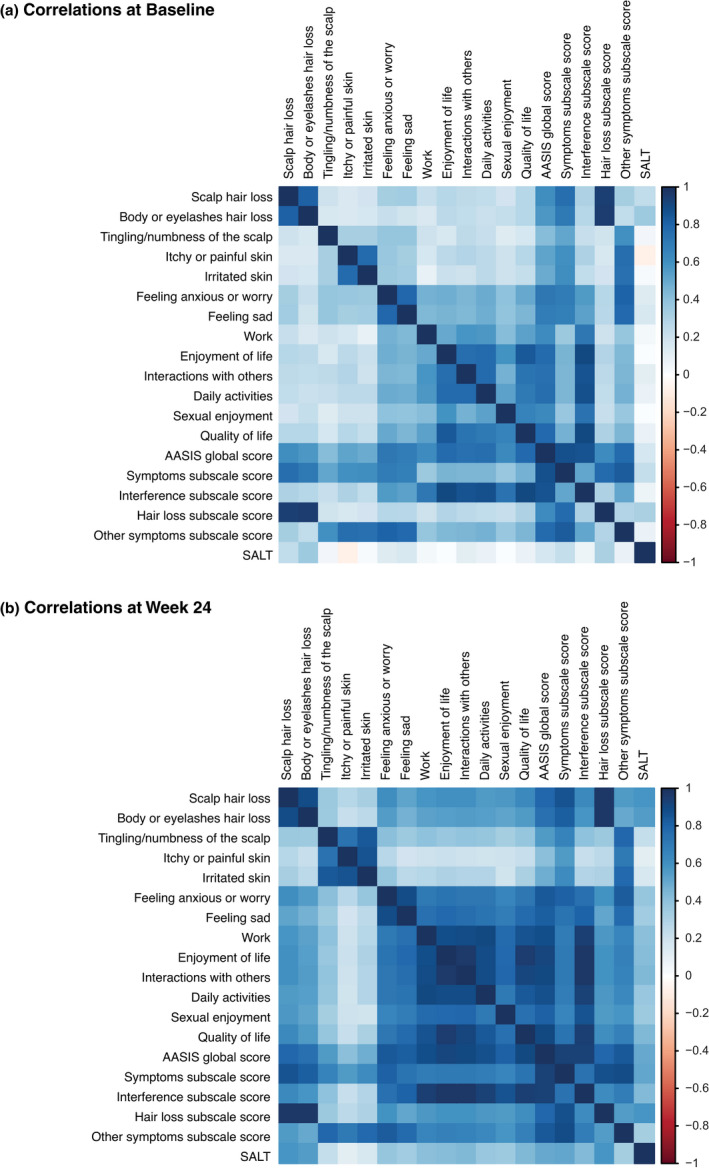
Correlation matrix heat map. Matrices depicting the correlation of Alopecia Areata Symptom Impact Scale global and subscale scores and Severity of Alopecia Tool scores (a) at baseline and (b) at week 24.

Correlation matrix heat map. Matrices depicting the correlation of Alopecia Areata Symptom Impact Scale global and subscale scores and Severity of Alopecia Tool scores (a) at baseline and (b) at week 24.