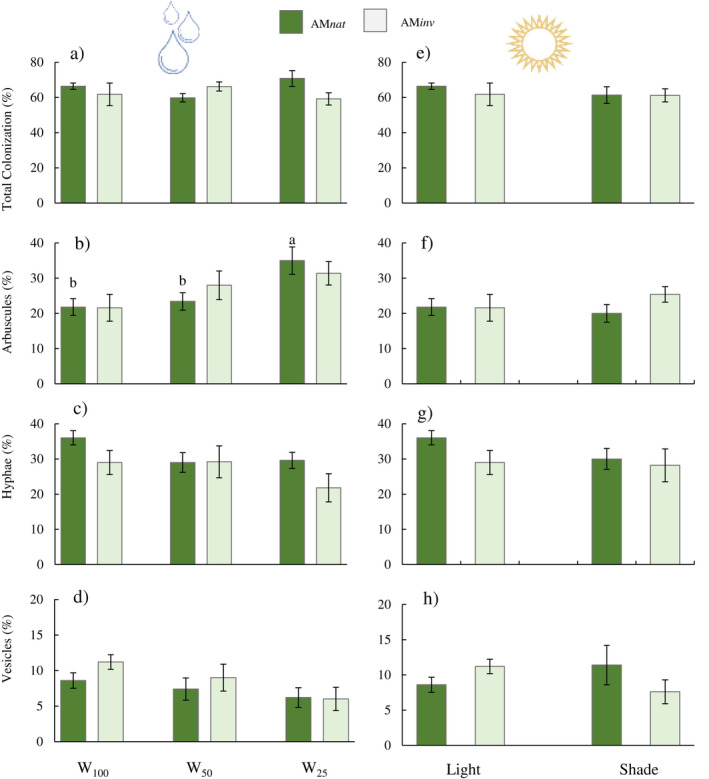
Fig. 4.

Mean (±SE) of (a) colonization, (b) arbuscules, (c) hyphae and (d) vesicles in P. lanceolata roots under drought stress (W100 = field capacity, W50 = 50% field capacity, W25 = 25% field capacity) or (e), (f), (g) and (h) under light stress (direct light or shade). Lowercase letters indicate significant differences in plants inoculated with AMnat after ANOVA using Tukey's HSD test or Student's t‐test at P ≤ 0.05.
