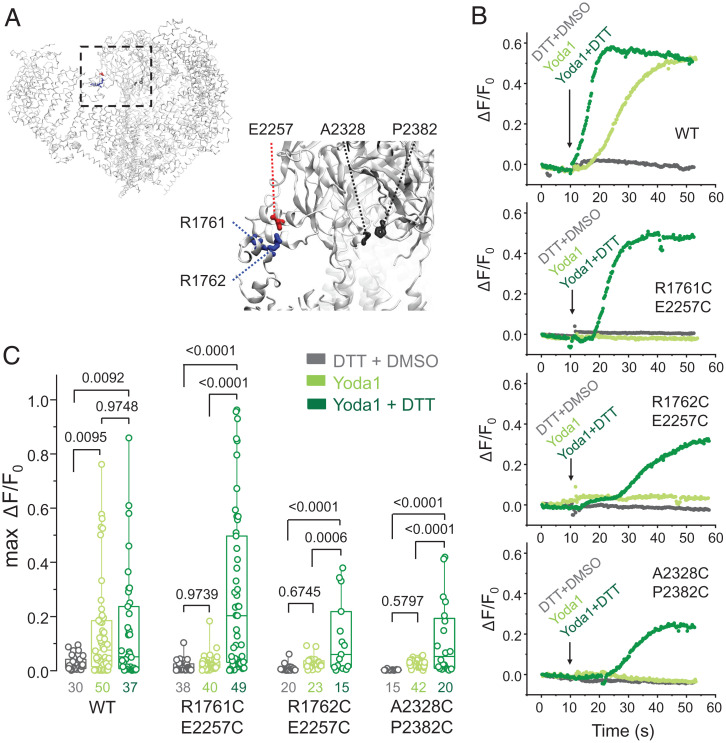
Fig. 1.
Gating motions are required for Yoda1-mediated mPiezo1 activation. (A) mPiezo1 structure (Protein Data Bank ID 6B3R) highlighting the positions of cysteine substitutions reported by Lewis and Grandl (52) (R1761C, R1762C, E2257C, A2328C, and P2382C). (B) Representative calcium-dependent fluorescence time courses from individual cells expressing double cysteine mutants or WT mPiezo1 in response to acute incubation with a saline solution containing 100 µM Yoda1 and supplemented or not with 25 mM DTT (DMSO was kept at 1% in all experiments). (C) Maximal amplitude of calcium-dependent fluorescence changes (max ΔF/F0) from experiments illustrated in B. Numbers below box plots represent the number of independent cells measured from a minimum of 8 to 12 culture wells. Numbers above box plots indicate exact P values from one-way ANOVA and post hoc Tukey multiple comparisons tests. Boxes indicate first and third quartiles, and horizontal lines indicate medians.

