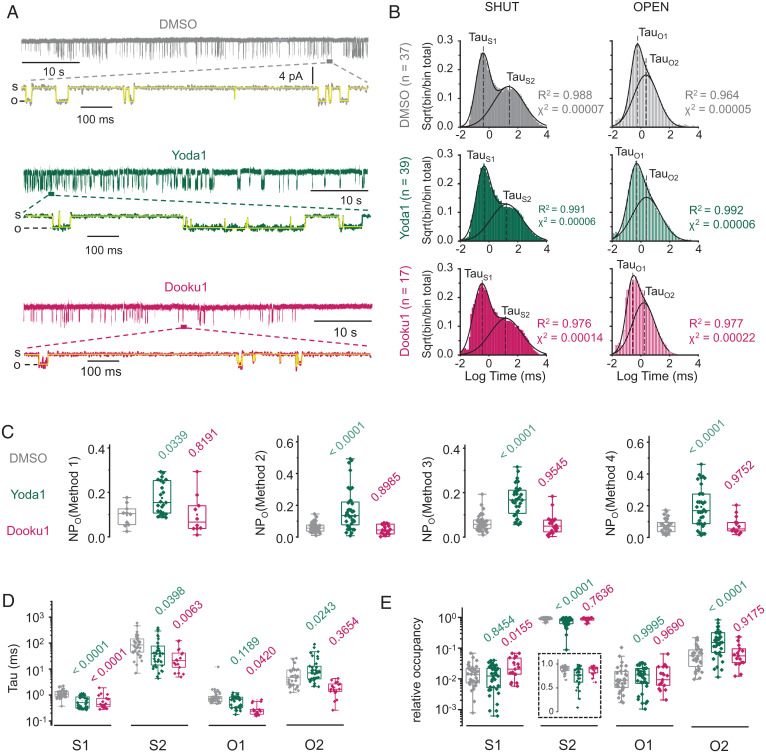
Fig. 2.
Modulation of single-channel dwell times by Yoda1 and Dooku1. (A) Exemplar 60-s single-channel current traces of mPiezo1 expressed in HEK293TΔPZ1 cells in the presence of 0.3% DMSO (gray), 30 µM Yoda1 (green), or 30 µM Dooku1 (fuchsia) in the patch pipette (temperature, 23 °C; V = −90 mV; s, shut; o, open). A 1-s expanded view is shown below each trace with pClamp time series idealization (yellow). (B) Aggregated dwell time distribution for open and shut states and for each experimental group (DMSO, n = 37; Yoda1, n = 39; Dooku1, n = 17). Lines are Gaussian fits to the data. (C) Scatter box plot comparison of NPo calculated with the indicated method (Materials and Methods) for three experimental groups (DMSO, 32 ≤ n ≤ 36; Yoda1, 34 ≤ n ≤ 40; Dooku1, 13 ≤ n ≤ 20). (D) Scatter box plot comparison of Tau values obtained for each state (DMSO, 35 ≤ n ≤ 37; Yoda1, 38 ≤ n ≤ 39; Dooku1, n = 17). (E) Scatter box plot comparison of relative occupancy for each state (DMSO, 34 ≤ n ≤ 35; Yoda1, 38 ≤ n ≤ 39; Dooku1, n = 17). Numbers above plots in C–E indicate P values from one-way ANOVA with Dunnett’s multiple comparisons post hoc tests (green, DMSO vs. Yoda1; fuchsia, DMSO vs. Dooku1). Boxes indicate first and third quartiles, and horizontal lines indicate medians. Temperature is clamped at 23 °C for all recordings.

