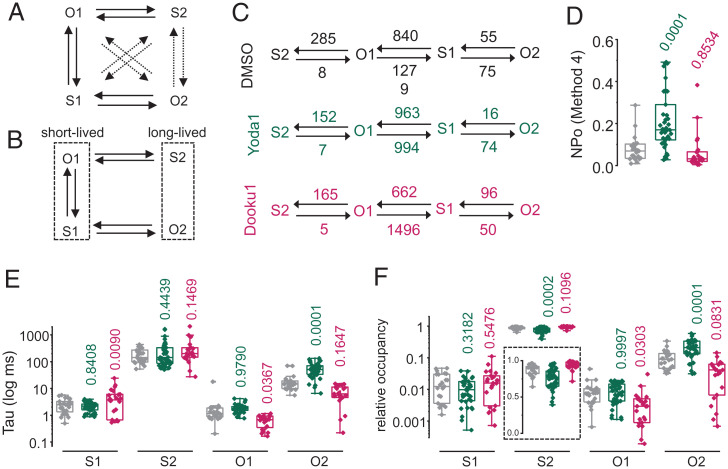
Fig. 3.
Markov chain modeling of single-channel trajectories at 23 °C. Topological representations for the (A) unconstrained and (B) minimal Markov chain models (dotted arrows indicate near-zero fitted rates). (C) Linear representations of the minimal model showing fitted rate constants obtained from the QUB software for each experimental condition. Numbers indicate fitted rate values (in s−1) rounded to the nearest one. (D) NPo values (calculated using method 4) predicted for each experimental condition. Scatter box plots showing (E) mean dwell time and (F) relative occupancy for each individual idealized trajectory analyzed using the minimal model shown in B. Boxes indicate first and third quartiles, and horizontal lines indicate medians. Numbers above plots indicate P values from one-way ANOVA with Dunnett’s multiple comparisons post hoc tests.

