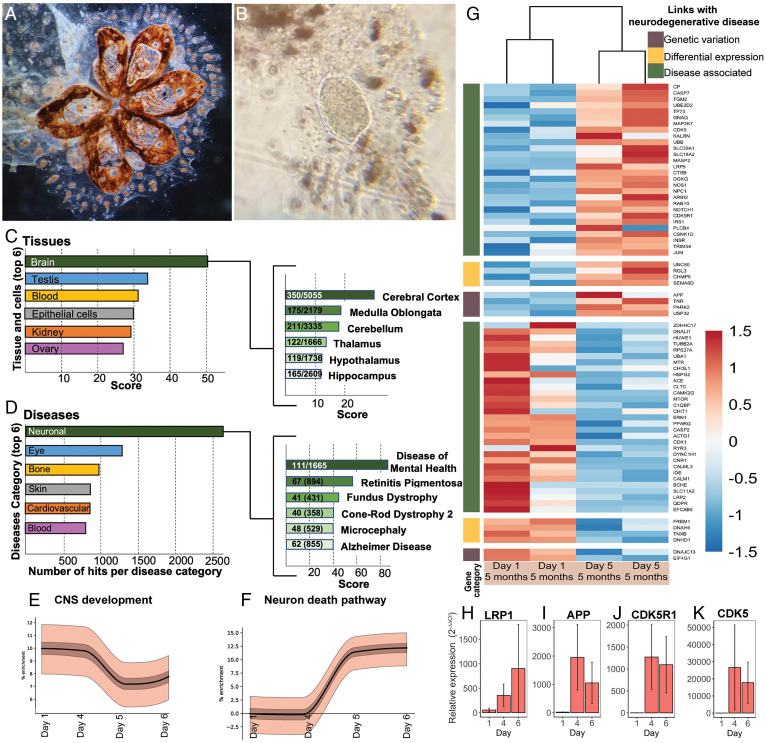
Fig. 5.
Significant changes in the expression of genes associated with mammalian neurodegeneration pathways are observed during the weekly degeneration cycles. (A) Colony after brain dissection. White dotted lines highlight tissues removed. (B) Extracted brain. (C and D) Analysis with GeneAnalytics of differentially expressed genes between early and late cycle in the enriched brain of B. schlosseri (RNA-seq). (C) Tissues and cell categories and (B) diseases associated with differentially expressed genes. For each panel, only the 6 categories with the highest score and number of hits per category are displayed (the complete lists can be found in SI Appendix, Supplementary Data 14–16). Right identifies the subgroupings which the contribute to the dominant category (i.e., the Brain for Tissues and Cells and Neuronal for Disease), with the numeric ratio describing the number of genes detected in B. schlosseri as compared to the total number of genes associated with the subgrouping within the database. In all cases, x-axis scores refer to the weighted sum of the scores of all matched genes in this category, normalized to the log of the maximal score that can be achieved for the category. (E and F) Enrichment plots showing increase in proportion of genes associated with the CNS development (E) and neuronal death pathway (F). The solid line is the proportion of active selected genes with the expected mean subtracted. Light and dark bands correspond to 50% and 99% confidence intervals, respectively. (G) Seventy-three putative homologous genes associated with neurodegenerative diseases are DE in the zooid brain during the weekly cycle. Categories are indicated based on the link that the gene has with the neurodegenerative disease (brown: genes having a genetic variation in patients with the disease; yellow: genes DE in patients with the diseases compared to the healthy controls; green: genes identified by scientific literature, cancer mutation data, and genome-wide association studies). Color scale depicts log2CPM normalized expression values scaled by row. (H–K) qPCR expression of selected genes on brain tissue. APP: amyloid precursor protein, CDK5: cyclin-dependent kinase 5, LRP1: low-density lipoprotein receptor related protein1, CDK5R1: cyclin dependent kinase 5 activator 1; error bars represent SEMs.

