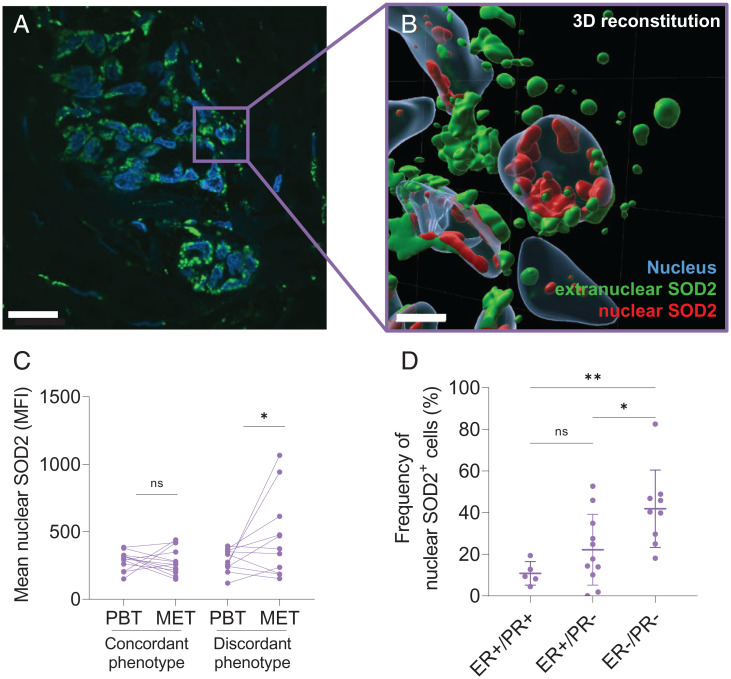
Fig. 7.
SOD2 localizes to the nucleus of tumor cells in patient-derived tumor biopsies. (A) Representative immunofluorescence staining of breast tumor biopsy (core A7) showing colocalization of SOD2 (green) and nuclear marker DAPI (blue) in 100× confocal magnification. (White scale bars, 20 µm.) (B) A 3D reconstruction of breast cancer cell nuclei (blue) showing cytoplasmic SOD2 (green) and nuclear SOD2 (red). (White scale bars, 5 µm.) (C) Nuclear SOD2 MFI in breast cancer tissue microarray indicates nuclear SOD2 signal is higher in samples with discordant hormone receptor status in PBT and corresponding MET. Lines connect PBT and MET from the same patients. (D) Increased number of nuclear SOD2 positive cells (nucSOD2+) in PBT correlates with aggressive breast cancer phenotype. ns, not significant. *P < 0.05, **P < 0.01; n = 25, error bars indicate mean ± SD.

