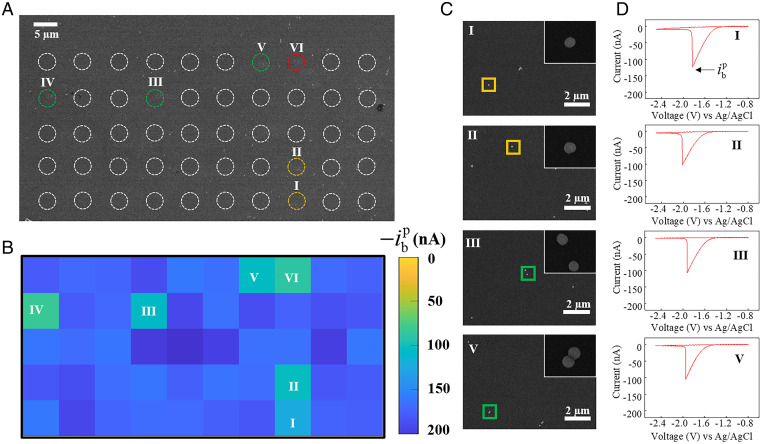
Fig. 2.
(A) SEM image of the glassy carbon surface with well-dispersed 50-nm-radius SiO2 nanoparticles. Circles represent locations of droplets left from SECCM measurement, while colors stand for SiO2 nanoparticle number within the droplet, with yellow for one, green for two, and red for three. (B) SECCM mapping of bubble nucleation current, , across the same surface as in A. (C) Zoomed-in SEM images of partial locations with nanoparticles and (D) corresponding voltammograms for single–H2 bubble formation. The Insets in C are the corresponding magnified SEM images of individual SiO2 nanoparticles.The peak currents at locations I, II, III, and V are –124.4, –103.3, –107.1, and –105.1 nA, respectively. In the experiment, a pipette with a 1.5-μm-radius tip opening and 2.0 M H2SO4 solution was used. Voltammograms were recorded at 0.5 V/s with a step size of 7 μm.

