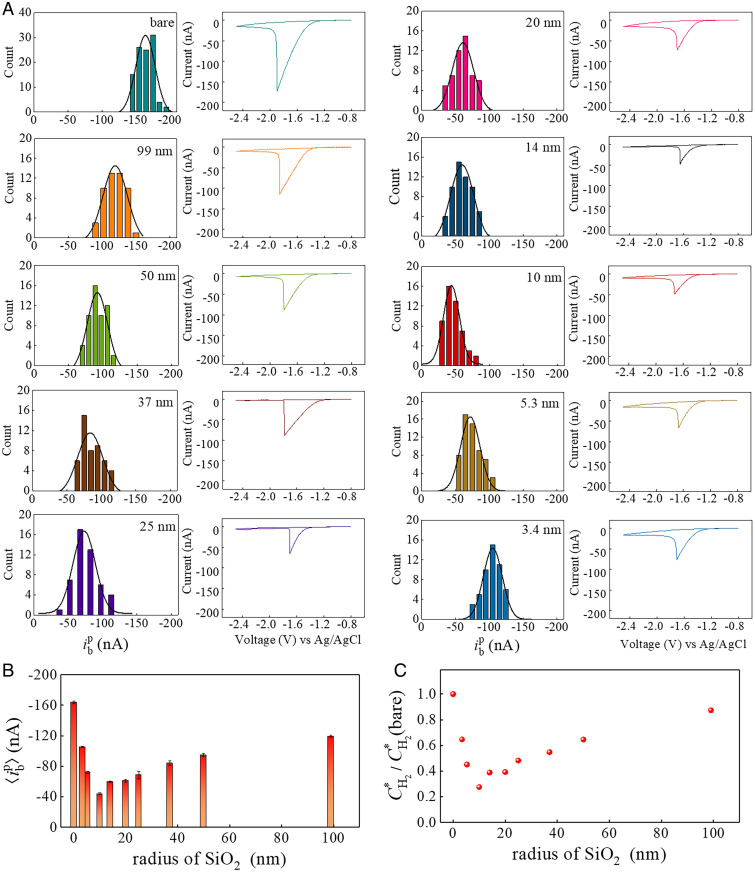
Fig. 3.
(A) Histograms of single–H2 bubble nucleation current, , on just one SiO2 nanoparticle as a function of nanoparticle radii. Each distribution contains about 50 independent measurements of bubble formation, and the distributions are fitted by Gaussian function with the mean nucleation current, , at –164.1 ± 1.7 nA for smooth glassy carbon surface; –119.2 ± 1.3 nA for 99 nm; –95.0 ± 2.1 nA for 50 nm; –83.9 ± 3.1 nA for 37 nm; –73.2 ± 1.4 nA for 25 nm; –61.1 ± 1.6 nA for 20 nm; –59.8 ± 1.0 nA for 14 nm; –43.9 ± 1.1 nA for 10 nm; –72.0 ± 1.5 nA for 5.3 nm; and –105.3 ± 0.8 nA for 3.4 nm. (B) The Gaussian peak position extracted from A, , as a function of SiO2 nanoparticle radii. (C) The normalized critical local surface H2 concentration, , obtained from the finite element simulation based on measurement results (B) as a function of SiO2 nanoparticles radii. stands for the local surface H2 concentration at bubble nucleation in the absence of an SiO2 nanoparticle, which is 119 mM from SI Appendix, Fig. S24A.

