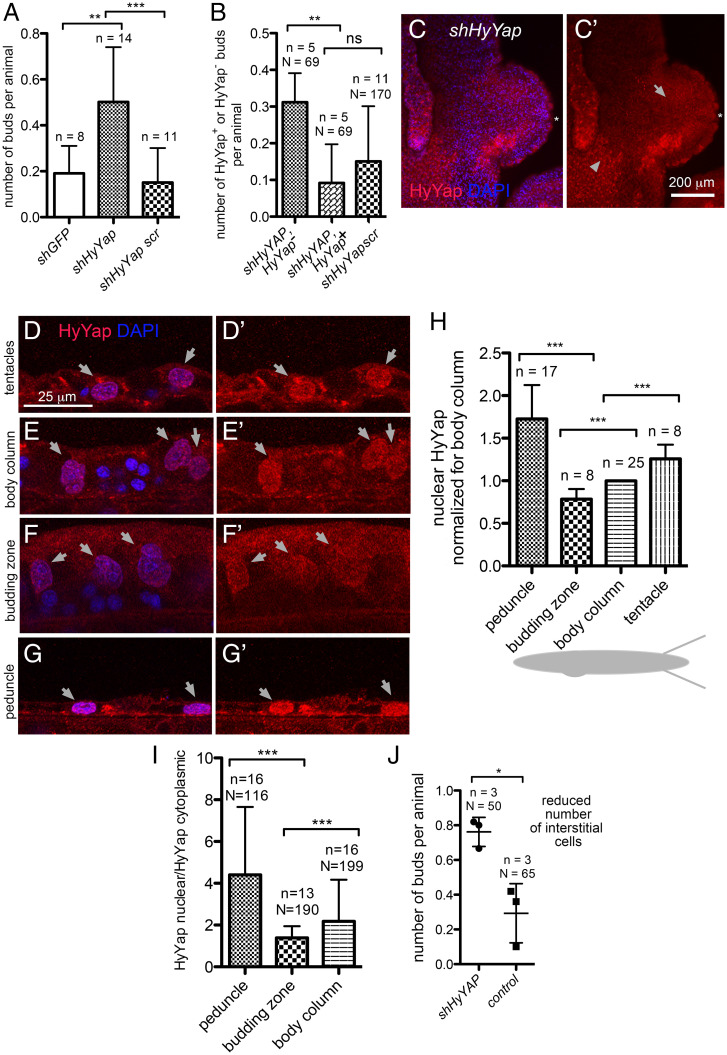
Fig. 2.
HyYap is a negative regulator of Hydra budding. (A) Graph showing an increased rate of budding in polyps electroporated with shHyYap compared to controls; n, number of experiments, each experiment included 10 to 20 polyps; two-tailed unpaired t test. (B) Graph shows that a significant majority of buds developed in polyps electroporated with shHyYap originated from HyYap− tissue; n, number of experiments; N, total number of polyps used in analysis; two-tailed unpaired t test. (C and C′) Lateral view of a bud developing from HyYap− tissue; asterisk points to the tip of the bud; arrow, to HyYap− tissue; arrowhead, to HyYap+ tissue. (D–G′) Lateral view of the ectoderm of tentacles (D and D′), body column (E and E′), budding zone (F and F′), and a peduncle (G and G′) immunostained with anti-HyYap serum; arrows point to nuclei of ectodermal epithelial cells. (H) Graph shows the intensities of HyYap immunostaining in nuclei of tentacles, body column, budding zone, and a peduncle normalized for intensity in the nuclei of a body column and superimposed on a schematic drawing of Hydra; for each animal, the average intensity of immunostaining was measured in the nuclei of ectodermal epithelial (10 to 20 nuclei for each area); n, number of polyps; two-tailed unpaired t test. (I) Graph shows nuclear/cytoplasmic ratio of HyYap in the body column, budding zone, and peduncle determined by immunostaining for each cell; N, number of cells; n, number of polyps; two-tailed unpaired t test. (J) Graph shows the budding rate in animals treated with 10 mM hydroxyurea for 48 h prior to electroporation; n, number of experiments; N, number of polyps; two-tailed unpaired t test. P values are: ns (P > 0.05), * (P ≤ 0.05), **(P ≤ 0.01), *** (P ≤ 0.001).

