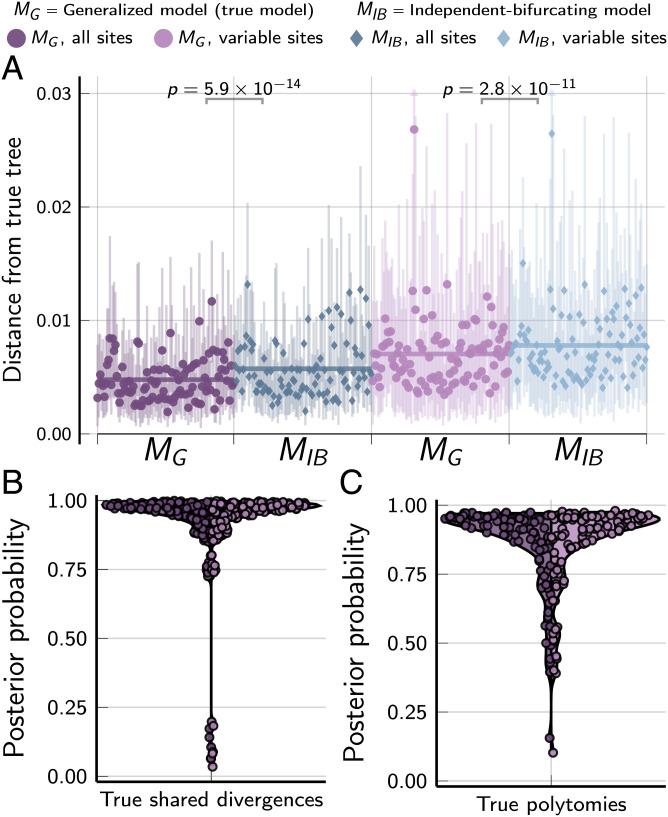
Fig. 4.
The performance of the MG and MIB tree models when applied to 100 datasets, each with 50,000 biallelic characters simulated on species trees randomly drawn from the MG tree distribution. (A) The square root of the sum of squared differences in branch lengths between the true tree and each posterior tree sample (46); the point and bars represent the posterior mean and equal-tailed 95% credible interval, respectively. P values are shown for Wilcoxon signed-rank tests (47) comparing the paired differences in tree distances between methods. Violin plots show posterior probabilities of all true shared divergences (B) and multifurcating nodes (C) across all simulated trees. For each simulation, the mutation-scaled effective population size () was drawn from a gamma distribution (shape = 20, mean = 0.001) and shared across all the branches of the tree; this distribution was used as the prior in analyses. Plots were created by using the PGFPlotsX [v1.2.10, Commit 1adde3d0 (48)] backend of the Plots [v1.5.7, Commit f80ce6a2 (49)] package in Julia [v1.5.4 (50)].

