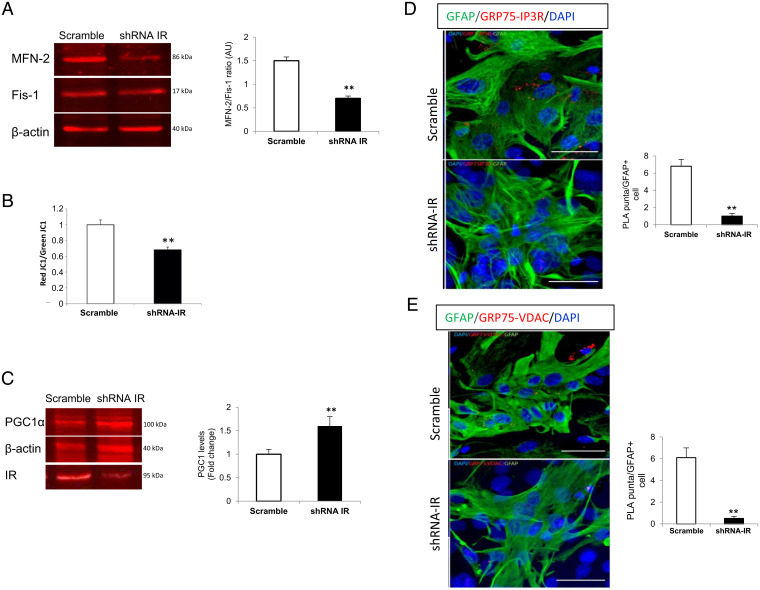
Fig. 8.
Altered mitochondrial dynamics in IR-deficient astrocytes. (A) Mitofusin 2 (Mfn2, a marker of mitochondrial fusion) and fissin1 (Fis1, a marker of mitochondrial fission) ratio in shRNA IR and scramble astrocytes (n = 9; t test, t = 3.06; **P < 0.01). (B) Relative quantification of mitochondrial depolarization using the mitochondrial membrane potential fluorescence indicator JC1 (red/green JC1 ratio) in scramble (n = 3) and shRNA IR (n = 8) cultures (two-tail t test, t = 3.77; **P < 0.01). (C) PGC-1α levels in shRNA IR and scramble astrocytes (n = 9; t test, t = 3.50; **P < 0.01). (D and E) Interactions of GFP75 with IP3R (D) (n = 7; t test, t = 3.75; **P < 0.01) and VDAC (E) revealed by PLA (n = 9; t test, t = 3.48; **P < 0.01). Representative images are shown from scramble and shRNA IR astrocytes (GFAP+ cells, green). Histograms show the ratio of PLA puncta per GFAP+ cell. Nuclei staining is with DAPI. (Scale bars, 40 µm.)

