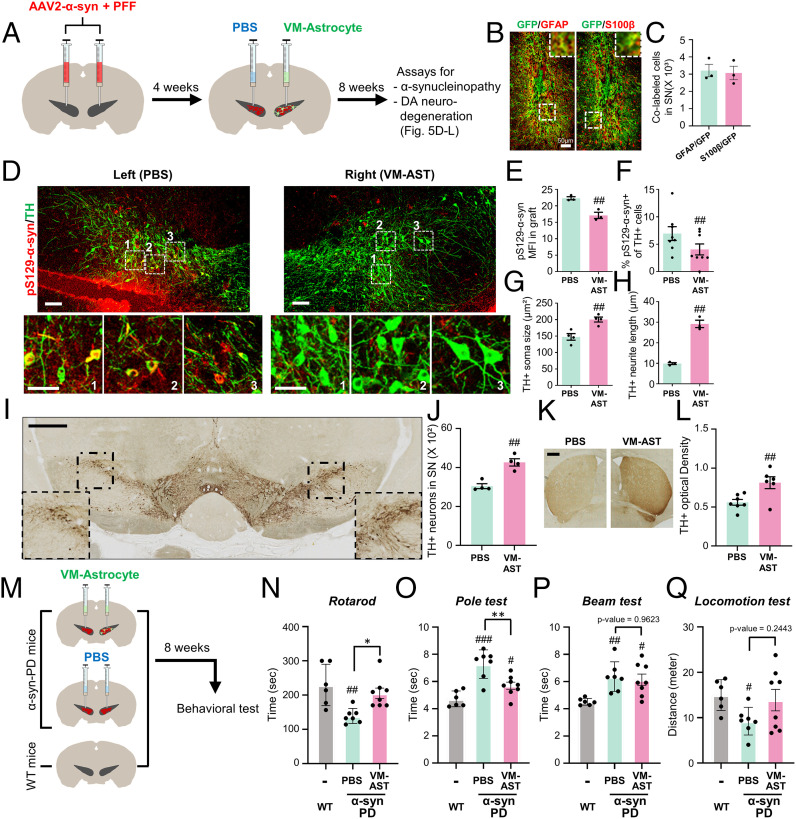
Fig. 5.
In vivo therapeutic functions of cultured astrocytes in α-synucleinopathic PD model mice. (A) Schematic of the experimental procedure. α-synucleinopathic PD (α-syn-PD) model mice were generated by bilateral injection of α-syn–expressing AAV2+α-syn PFF into the midbrain SN. Cultured VM astrocytes were transplanted into the right side of the midbrain SN in the PD mice (PBS injection [sham-operated] to the left SN). Two months posttransplantation, α-syn pathology and DA neuron degeneration in the right SNs transplanted with the astrocytes were compared with those in the left SNs (sham-operated) of the same animals. (B and C) Engraftment of transplanted astrocytes. α-syn-PD mice were grafted with VM astrocytes transduced with GFP-expressing lentivirus. Two months later, efficiency of cell engraftment was assessed by counting GFP+ cells coexpressing the astrocyte-specific markers GFAP and S100β. (Insets) Enlarged images of boxed areas. (D–F) Alpha-synucleinopathy assessed by percent pS129-αsyn immune intensities and pS129-αsyn+/TH+ cells. Boxed areas are enlarged in the lower panel. (G and H) DA neuron degeneration assessed by soma sizes (G) and fiber lengths (H) of the TH+ DA neurons (immunefluorescence stained), numbers of DA neurons (I and J), and TH+ fiber intensity in the striatum (K and L) (DAB-stained). (Insets) Enlarged images of boxed areas. Significant differences from the left side of SN of the identical animals at ##P < 0.01 and ###P < 0.001. n = 3 to 8 mice, paired t test. (M–Q) Behavioral assays. Schematic of the experimental procedure (M). VM astrocytes were grafted bilaterally into the SNs of α-syn-PD mice, and behaviors of the mice were assessed compared with sham-operated (PBS-injected) and age-matched WT mice. Behaviors of the PD mice were assessed by rotarod (N), pole (O), beam (P), and locomotor activity test (Q) at 8 wk posttransplantation. Significant differences from WT mice at #P < 0.05, ##P < 0.01, and ###P < 0.001 and from PD mice (PBS injection [sham-operated]) at *P < 0.05 and **P < 0.01, n = 6 (WT), 7 (PD and PBS), or 8 (PD and VM-Ast), one-way ANOVA, followed by Bonferroni post hoc analysis. (Scale bars: 50 μm in B, D, and I and 500 μm in K.)

