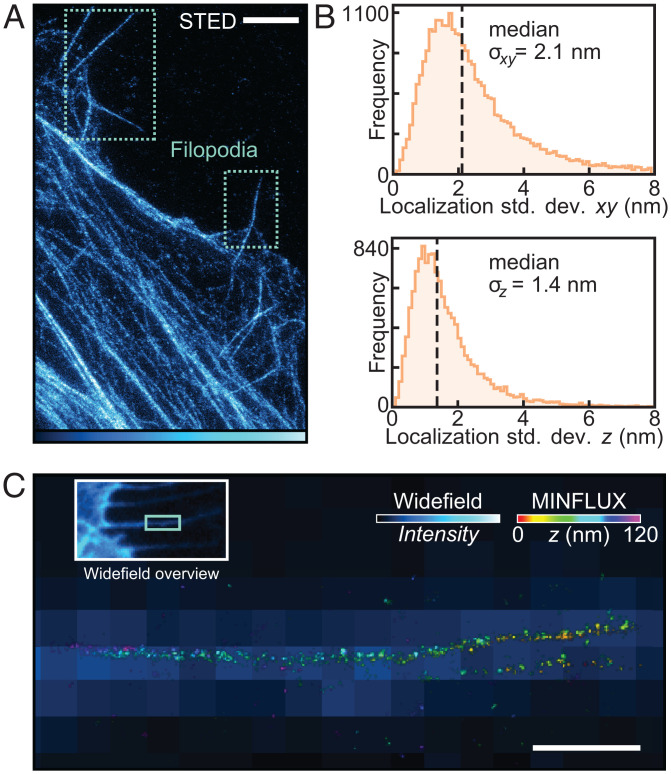
Fig. 5.
Superresolution imaging of U2OS filopodia labeled by genetic code expansion. (A) STED image of β-actinPrK118 labeled with picolyl-azide silicon rhodamine in U2OS cells, highlighting filopodia. (Scale bar: 2 μm.) (B) Distributions for the estimated precision of Alexa Fluor-647 localizations from 14 separate MINFLUX measurements of filopodia. (C) Overlay of a widefield and corresponding MINFLUX image depicting a representative filopodium that protrudes straight out of the cell. MINFLUX localizations were processed and then rendered by the program Imaris as described in SI Appendix, section 1. (Scale bar: 500 nm.)

