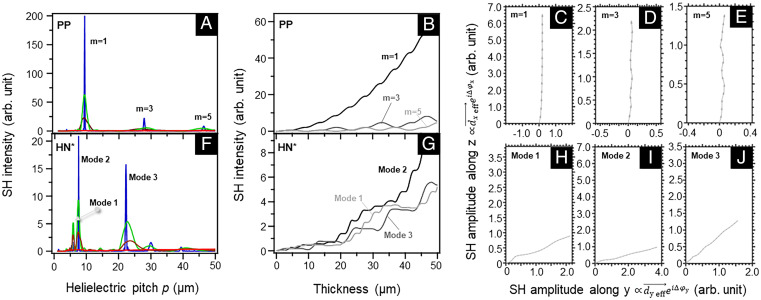
Fig. 2.
The comparison of numerical simulations of SH signals for (A–E) PP and (F–J) HN* structures. (A and F) The helielectric pitch dependencies of the SH intensity calculated at medium thicknesses of 5 (red), 30 (brown), 50 (green), and 500 (blue) μm. For the medium of 500 µm, the result is scaled by a factor 1/30 for better visualization to others. (B and G) The medium thickness dependence of SH intensity under QPM conditions. For PP structure (B), the results with m = 1, 3, and 5 are shown. For HN* structure (G), the results for modes 1 to 3 are shown. (C–E and H–J) The tracking of the complex amplitude of SH wave () with distance during traveling through a 50 µm medium for each mode of PM in PP (C and D) and HN* (H–J) structures. The length of segmental vectors is 0.5 in C, 0.2 in D, and 0.1 in E and H–J, which are obtained by data average. Here and are used for the calculations. The corresponding coherence length µm in the PP structure.

