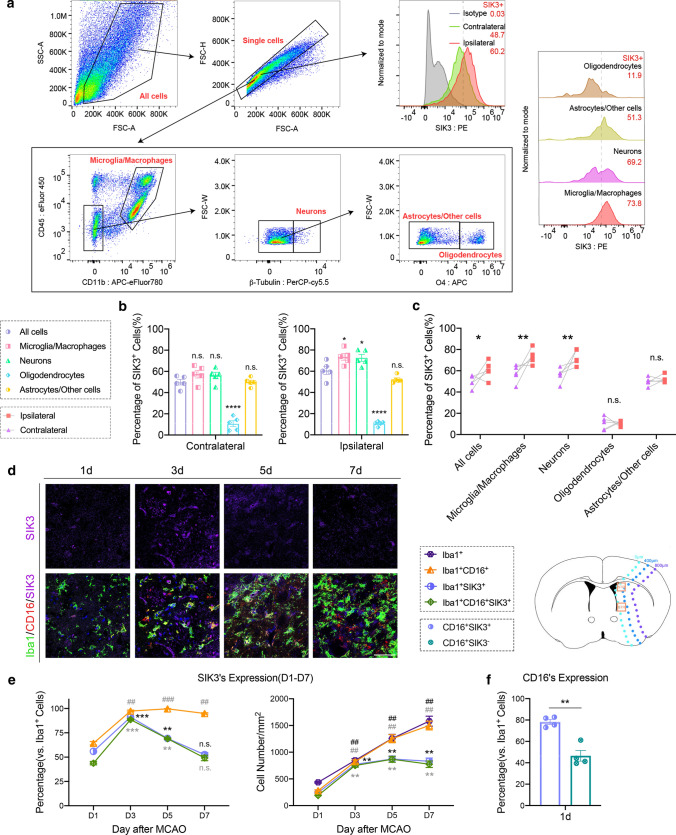
Fig. 2.
SIK3 is highly expressed in pro-inflammatory Mi/MΦ after tFCI in WT mice. a Flow cytometric gating and analysis scheme. b, c Expression of SIK3 in total cells, Mi/MΦ, neurons, oligodendrocytes, astrocytes and others cells by flow cytometry assessed 3d after tFCI (compared with total groups in the left and middle panel). d Representative images of Iba1/CD16/SIK3 triple immunostaining in STR 1, 3, 5, and 7d after tFCI (scale bar: 50 µm). e Quantification of the number (right panel) or percentage (left panel) of activated SIK3+/CD16+ Mi/MΦ in 0–400 µm from the damaged edge (schematic in Fig. 1a down panel) of STR 1, 3, 5, and 7d after tFCI (vs. D1). f Quantification of the percentage of CD16+ cells in SIK3+Mi/MΦ or SIK3−Mi/MΦ in 0–400 µm from the damaged edge of STR 1d after tFCI. N = 4–5/group. ##p < 0.01, ###p < 0.001, *p < 0.05, **p < 0.01, ***p < 0.001, ****p < 0.0001, as indicated and assessed by multiple t-tests, one-way ANOVA or two-way ANOVA repeated measurement and Bonferroni post hoc were used for statistical analysis

