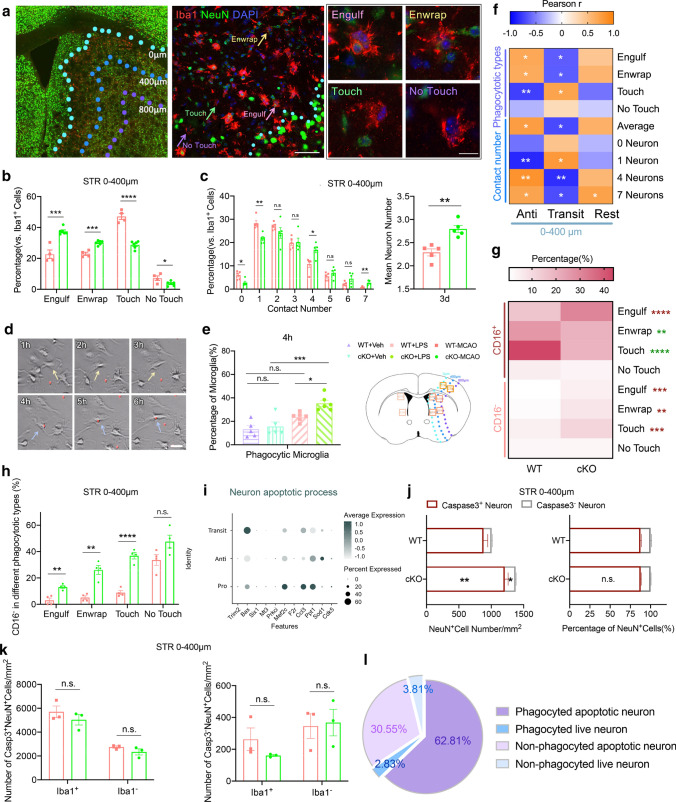
Fig. 4.
SIK3-cKO promoted Mi/MΦ non-specific phagocytosis of neurons after tFCI. a Representative images of Iba1/NeuN double immunostaining in STR 3d after tFCI (middle panel scale bar: 100 µm; right panel scale bar:10 µm). b Quantification of the percentage of Mi/MΦ in the “Engulf,” “Enwrap,” “Touch,” and “No Touch” states of phagocytosis in the penumbra within 0–400 µm from the damaged edge in STR 3d after tFCI. c Quantification of the percentage of Mi/MΦ that made contact with neurons grouped by the number of contacted neurons in 0–400 µm from the damaged edge of STR 3d after tFCI. d Representative images of primary microglia phagocyting 2 µm latex beads 4 h after LPS treatment. Yellow arrows represented non-phagocytic microglia. Blue arrows represented phagocytic microglia (scale bar: 25 µm). e Quantification of the percentage of phagocytic Mi/MΦ 4 h after adding latex beads (8 h after LPS treatment). Data are from 3 independent experiments. f Correlation analysis of Mi/MΦ with the Anti, Transit, or rest phenotype in the different phagocytic states in 0–400 µm from the damaged edge of STR 3d after tFCI. g Correlation of CD16+ or CD16− with “Engulf,” “Enwrap,” “Touch” and “No Touch” phagocytic states in 0–400 µm from the damaged edge of STR 3d after tFCI. h Quantification of the percentage of CD16− Mi/MΦ in the “Engulf,” “Enwrap,” “Touch” and “No Touch” states, respectively, in 0–400 µm from the damaged edge of STR 3d after tFCI. n = 4/group. i Bubble matrix of “neuron apoptotic process”-related genes in the pro-, anti-inflammatory, and the transitional Mi/MΦ. j Quantification of the number/percentage of Caspase3+NeuN+ or Caspase3−NeuN+ in the Mi/MΦ in the “Engulf” state in 0–400 µm from the damaged edge of STR 3d after tFCI. k Quantification of the number of apoptotic and live neurons in 0–400 µm from the damaged edge of STR 3d after tFCI. n = 3–6/group. l Quantification of the percentage of apoptotic and live neurons in WT mice in 0–400 µm from the damaged edge of STR 3d after tFCI. n = 3/group. *p < 0.05, **p < 0.01, ***p < 0.001, ****p < 0.0001, as indicated using multiple t tests with Bonferroni post hoc analysis

