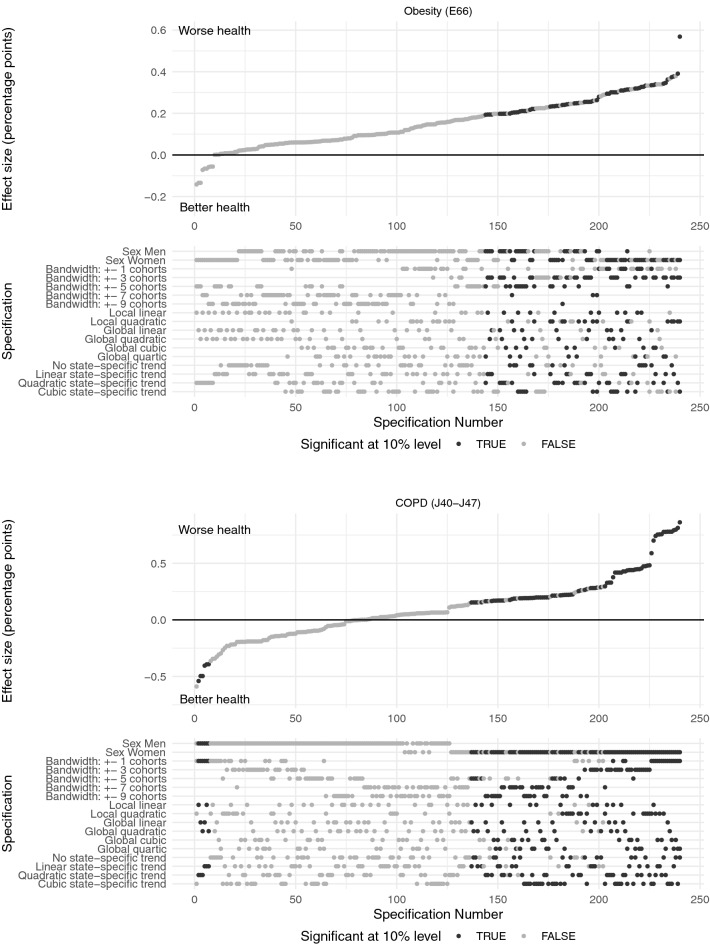
Fig. 4.
The figure shows the results of the specification curve analyses of the effect of the reforms on the probability to suffer from obesity (E66) and COPD (J40-J47), respectively. Each dot in the top panel represents a point estimate from a different model specification. The specifications are ordered by effect size. The dots vertically aligned below indicate the combination of analytic decisions behind those estimates. Dark grey dots represent significant effects (), while light grey dots show insignificant effects. Source: KBV claims data

