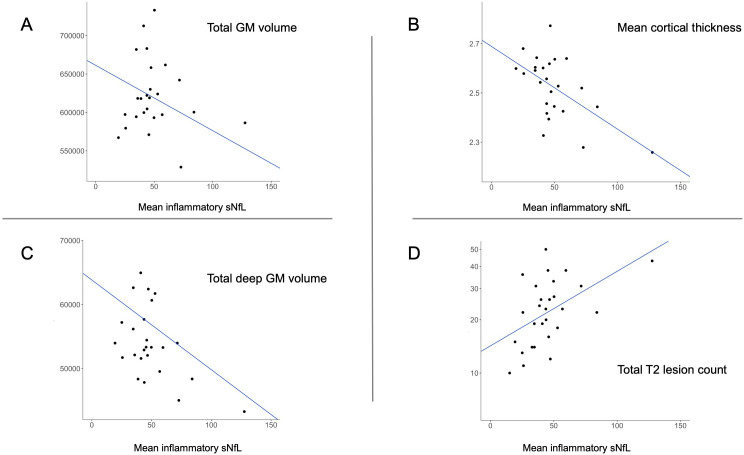
Figure 2.
Scatterplots illustrating significant associations between mean inflammatory sNfL level (pg/mL) and (A) total GM volume (mm3), (B) mean cortical thickness (mm), (C) total deep GM volume (mm3) and (D) total T2 lesion count (N). The Y-axis is transformed to logarithmic scale to illustrate the absolute lesion count. Cth, cortical thickness; GM, grey matter; sNfL, serum neurofilament light chain.

