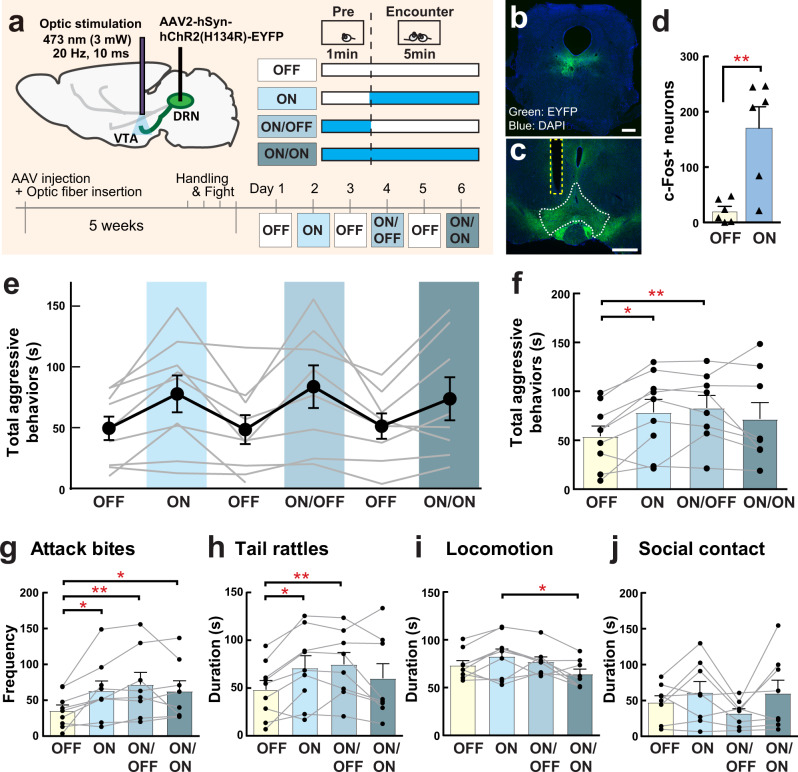
Fig. 8. Optogenetic activation of DRN-VTA projection neurons increases aggressive behavior.
a Schematics and timeline of this experiment. AAV2-hSyn-ChR2-EYFP was injected into the DRN, and the optic fiber was inserted into the VTA. Stimulation schematics were same as in Fig. 5. Expression of ChR2-EYFP (green) in the DRN (b scale bar 500 μm) and their projections in the VTA (c scale bar 500 μm). Blue: DAPI. d Light stimulation increased c-Fos expression in the VTA after 1 min light stimulation (unpaired t test (two-sided), OFF n = 6, ON n = 6 biologically independent animals, t(10) = 3.796, p = 0.0035). e Duration of total aggressive behaviors in each session. Black line indicates average data of 9 animals (Mean±SEM), and gray line indicates each individual’s data. f Summarized data for the duration of total aggressive behavior in each condition. Value of OFF session was calculated as average data from Day 1, 3, and 5. Both ON and ON/OFF sessions showed significantly longer duration of aggressive behavior compared to the OFF session (mixed-effects analysis (two-sided), n = 9 biologically independent animals, F(1.977,14.50) = 5.133, p = 0.0209, post hoc t test with Tukey’s multiple comparisons test (two-sided)). Detailed behavioral analysis showed that all stimulation schematics (ON, ON/OFF, ON/ON) increased attack bites compared to OFF session (g mixed-effects analysis (two-sided), n = 9 biologically independent animals, F(3,22) = 6.268, p = 0.0031, post hoc t test with Tukey’s multiple comparisons test (two-sided)), whereas only ON and ON/OFF sessions showed significant increases in the duration of tail rattles compared to OFF session (h mixed-effects analysis (two-sided), n = 9 biologically independent animals, F(1.949,14.30) = 5.669, p = 0.0159, post hoc t test with Tukey’s multiple comparisons test (two-sided)). By contrast, ON/ON session showed a significant reduction of locomotion compared to ON session (i; mixed-effects analysis (two-sided), n = 9 biologically independent animals, F(1.977,14.50) = 5.133, p = 0.0209, post hoc t test with Tukey’s multiple comparisons test (two-sided)). No effect of light stimulation was observed in social contact (j Friedman test (two-sided), n = 9 biologically independent animals, n.s.). Each bar represents mean value ± SEM, and gray line indicates each individual’s data. *p < .05, **p < .01. Source data are provided as a Source Data file.

