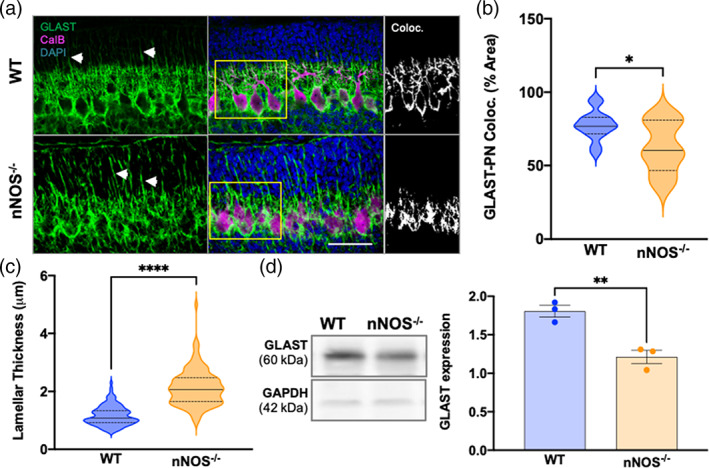
FIGURE 2.

BG‐PN colocalization and total GLAST expression decreased at PD7 in nNOS−/− cerebella compared with WT (a) representative confocal images of WT and nNOS−/− cerebella showing GLAST (green), CalB (magenta), and nuclei stained with DAPI (blue). White arrows highlight BG lamellar processes. Scale bar represents 50 μm. Depicted in the third panel are representative images of GLAST‐CalB colocalization analysis with white representing the overlay of GLAST+CalB staining. (b) Violin plots represent the area of GLAST+CalB staining in relation to total CalB staining within a consistent ROI, represented as % area. N = 4 biological replicates per group; WT n = 14 ROIs, nNOS−/− n = 8 ROIs. p = .0161. (c) Violin plots represent lamellar process thickness, measured in μm. N = 4 biological replicates per group. WT n = 125 processes, nNOS−/− n = 112 processes. p < .0001. (d) Representative western blot of total GLAST protein expression for PD7 WT and nNOS−/− cerebella and housekeeping protein GAPDH. Bar graph represents GLAST protein expression normalized to GAPDH. N = 3 biological replicates per group. p = .0065
