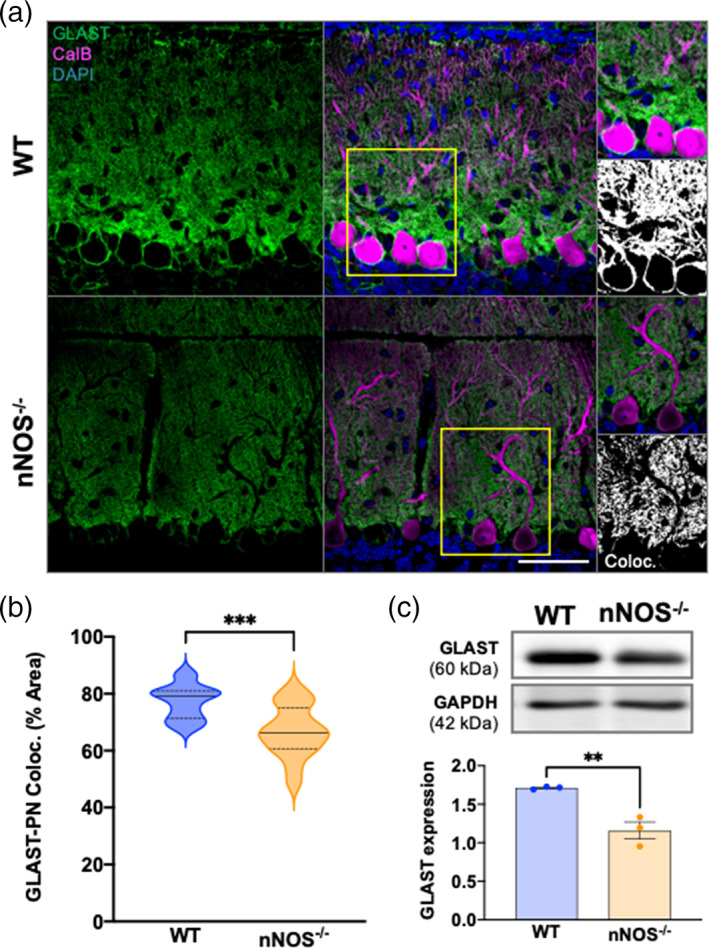
FIGURE 3.

BG‐PN colocalization and total GLAST expression is decreased in 2 weeks nNOS−/− cerebella compared with WT. (a) Representative confocal images of GLAST (green) and CalB (magenta) expression in WT and nNOS−/− cerebella with nuclei stained by DAPI (blue). Scale bar represents 50 μm. Representative image of GLAST‐CalB colocalization analysis depicted in the third panel, with white representing the area of GLAST+CalB overlay. (b) Violin plots represent the area of GLAST+CalB overlay in relation to the total area of CalB staining within a consistent ROI, represented as % area. N = 4 biological replicates per group; WT n = 14 ROIs, nNOS−/− n = 16 ROIs. p = .0009. (c) Representative western blot of total GLAST protein expression in 2 weeks WT and nNOS−/− cerebella and housekeeping protein GAPDH, along with bar graph presenting GLAST expression normalized to GAPDH. N = 3 biological replicates per group. p = .0077
