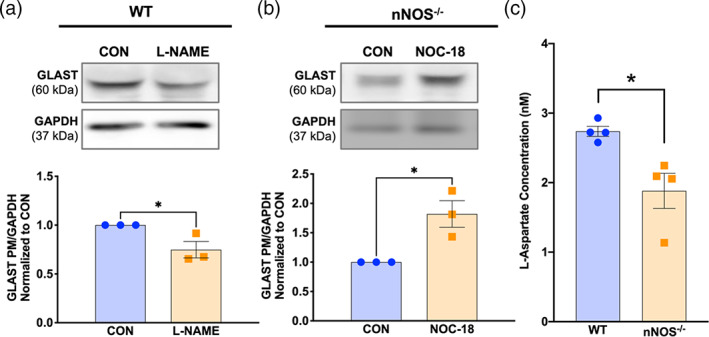
FIGURE 5.

Nitric oxide modulates GLAST expression in an ex vivo model, and BG from nNOS−/− mice display deficits in GLAST functionality. (a) Representative western blot of total GLAST expression in WT slices that were left untreated (CON) or treated with 100 μM L‐NAME. Bar graph represents N = 3 experimental replicates. p = .0403. (b) Representative western blot of total GLAST expression in nNOS−/− slices that were left untreated (CON) or treated with 300 μM NOC‐18. Bar graph represents N = 3 experimental replicates. p = .0222. (c) Bar graph represents the concentration of l‐aspartate taken up by WT and nNOS−/− astrocyte cultures after 30 min of l‐aspartate treatment. N = 4 experimental replicates. p = .0172
