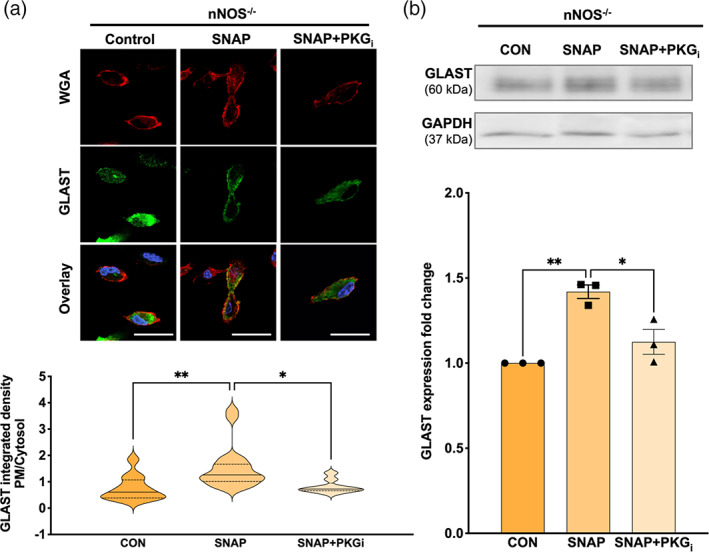
FIGURE 7.

PM localization and total expression of GLAST is increased by NO application in nNOS−/− BG. (a) Representative confocal images of WGA (red), GLAST (green), and nuclear staining DAPI (blue) fluorescence in nNOS−/− BG that were left untreated (CON) or treated with either 250 μM SNAP or a combination of SNAP and 10 mM PKGi (SNAP+PKGi). Scale bar represents 50 μm. Violin plots represent a ratio of PM‐localized GLAST immunofluorescence to cytosol‐localized GLAST immunofluorescence. N = 4 experimental replicates per group; CON n = 12 cells, SNAP n = 19 cells, SNAP+PKGi n = 9 cells. F(2, 37) = 7.022; p = .0026. (b) Representative western blot of GLAST expression in nNOS−/− astrocyte cultures left untreated (CON) or treated with SNAP or SNAP+PKGi. Bar graph represents GLAST expression normalized to the housekeeping protein GAPDH. N = 3 biological replicates per group. F(2, 6) = 20.24; p = .0022
