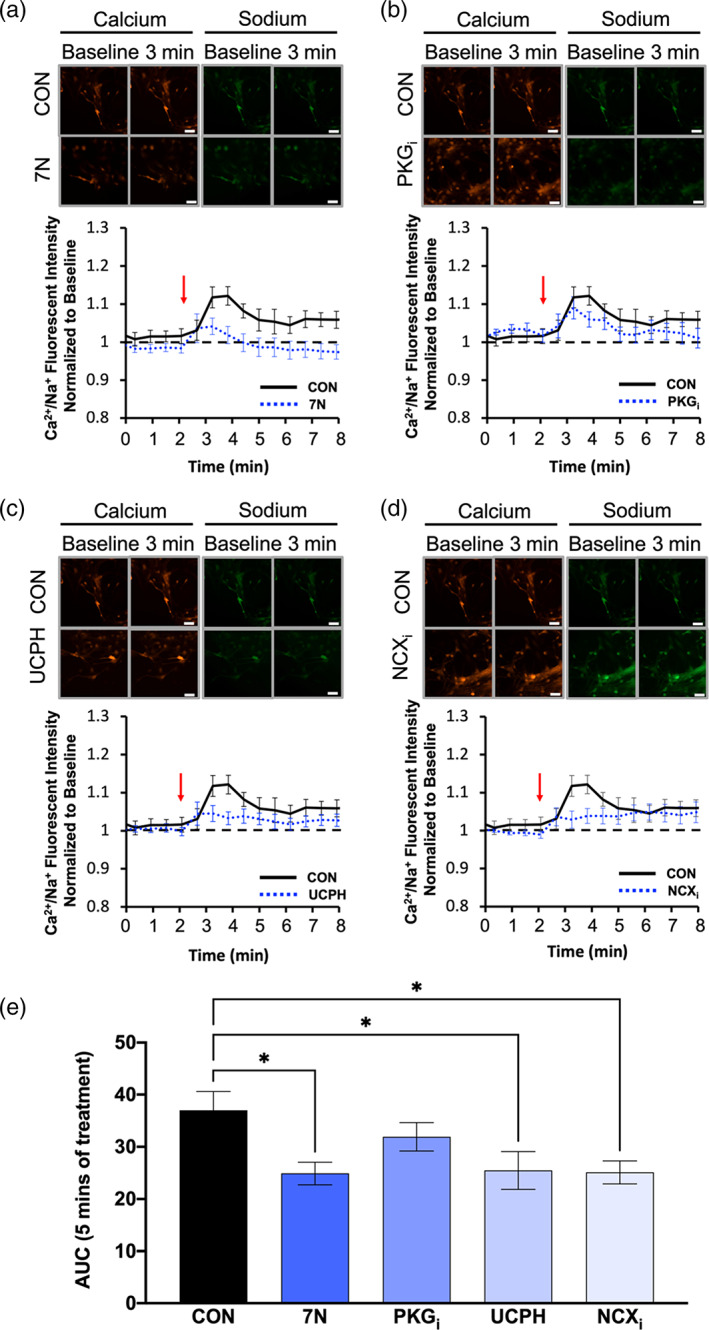
FIGURE 9.

Ca2+/Na+ influx is downregulated by nNOS blockade in WT BG. (a–d) images from a–d represent calcium (red) and sodium (green) responses at baseline and 3 min after d‐aspartate application (scale bar represents 100 μm). The representative time course of Ca2+/Na+ influx in response to application of d‐aspartate, denoted by the red arrow. The black line represents the Ca2+/Na+ influx of WT BGs without a pretreatment (CON), while the blue line represents either WT BGs pretreated with 7N (a), PKGi (b), UCPH (c), or NCXi (d). Black, dashed line represents baseline Ca2+/Na+ conductance. (e) Bar graph represents the area under the curve (AUC) for each pretreatment visualized in a–d after 5 min of d‐aspartate treatment. N = 3 experimental replicates. CON n = 25 cells, 7N n = 24 cells, PKGi n = 24 cells, UCPH n = 27 cells, NCXi n = 21 cells. F(4, 130) = 3.408; p = .0110
