
Fig. 2.
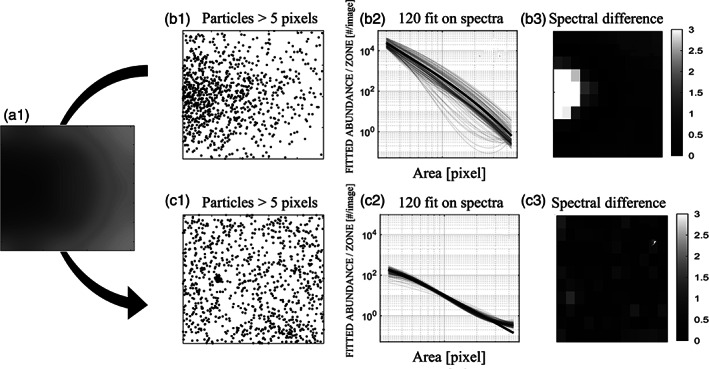
Examples of data from UVP6 000007LP showing the effect of zonal correction on the size spectra of particles: (a) image of the gain correction matrix to be applied to the raw image; (b) example of UVP6 data obtained without application of the correction matrix, presented here for illustrative purposes only; (c) real UVP6 data obtained after application of the correction matrix, with (1) position of selected particles, (2) size spectra in the 120 zones of the image, and (3) spectral differences in the 120 zones. The result of the application of the gain correction matrix is evaluated by the homogeneity among spectra in the 120 zones of the image (c2 and c3).