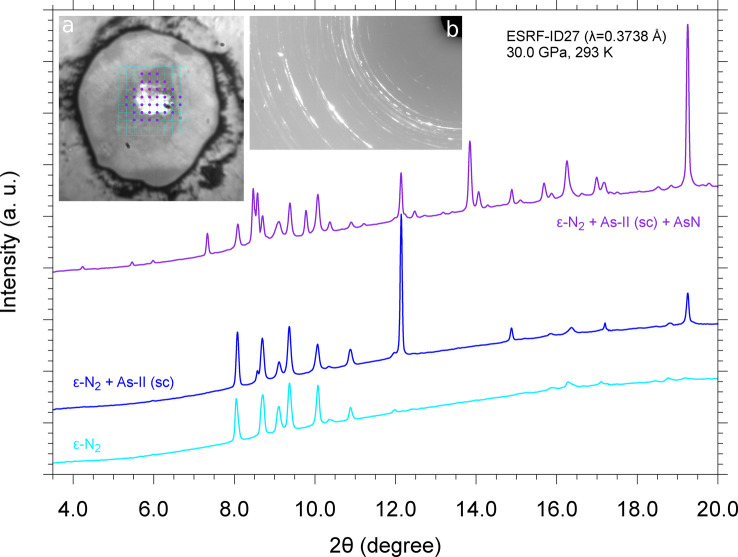
Figure 1.
Selected integrated XRD patterns corresponding to panoramic acquisitions at room T and 30 GPa on different points of the sample laser heated at 25.0 GPa. The patterns were acquired in the points of the grid superimposed to the sample image (a), which shows a shining area at the center, corresponding to the original piece of As (As‐II, sc), surrounded by N2 (ϵ‐N2). The violet full circles on the grid indicate the points of the sample where the reaction product AsN was detected (violet upper trace), whereas the unlabeled points on the outer part of the grid indicate the sample points where only ϵ‐N2 (cyan lower trace) or only ϵ‐N2 and sc‐As (blue middle trace) where observed. A portion of a detector image, acquired in one of the violet points of the grid, is shown in (b).

