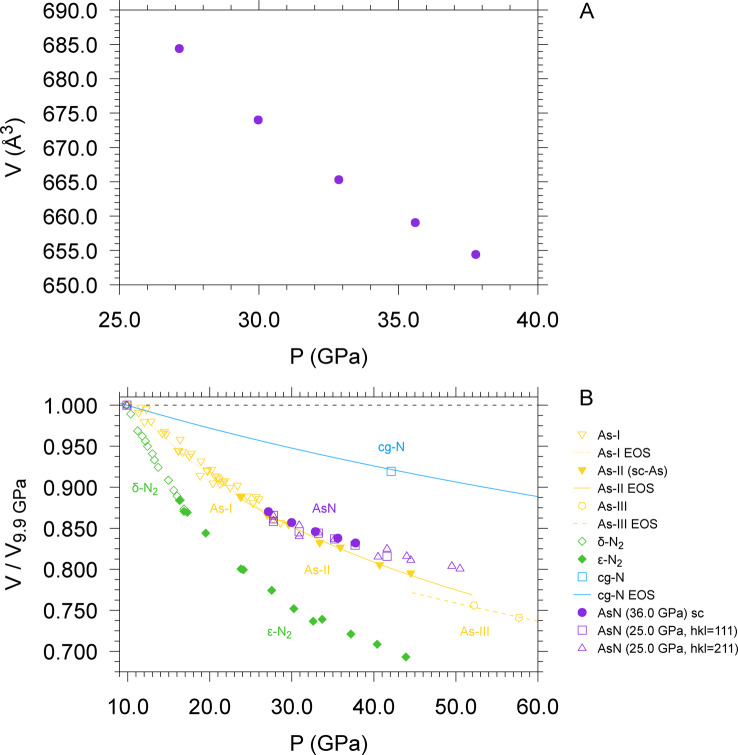
Figure 2.
A) Evolution with pressure of the unit cell volume of AsN at room T obtained from single crystal data refinement. The plotted data were acquired during the decompression of the sample synthesized at 36.0 GPa. All the pressures were obtained by averaging the values obtained from Au and ruby calibrants. The data point at 38.6 GPa mentioned in the text is not shown here for dataset consistency, due to absence of the Au pressure value for this data point. For the volume corresponding to 27.2 GPa only the unit cell parameters, with no refinement of the atomic positions, could be obtained. B) Evolution with pressure of the unit cell volume of N2, [43] As,[ 30 , 45 ] cg‐N [23] and AsN, normalized to the volume of their stable phase at room T and 9.8 GPa, corresponding to the lowest pressure at which AsN was observed. For AsN the filled circles correspond to the data plotted in (A), whereas the empty squares and up triangles correspond to data from the sample synthesized at 25.0 GPa, respectively obtained using the 111 and 211 reflections of AsN observed in azimuthally integrated patterns (Figure SI‐10). The EOS of As‐I, As‐II, As‐III[ 30 , 45 ] and cg‐N [23] are also plotted.

