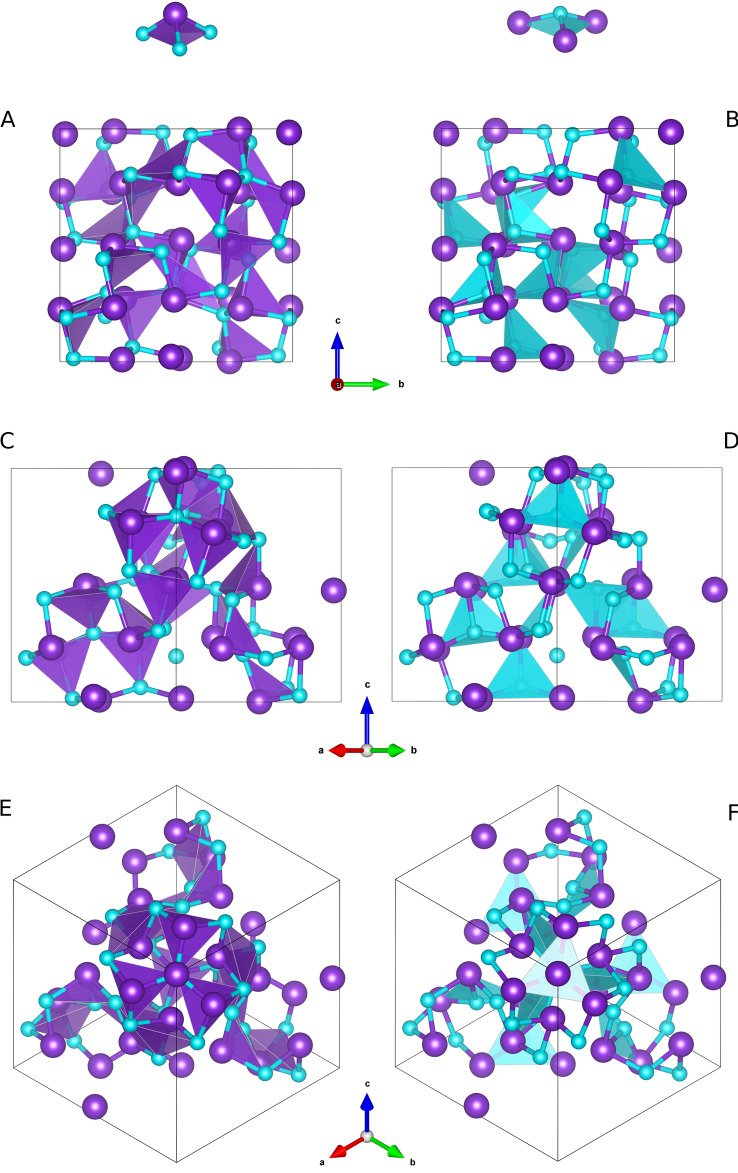
Figure 3.
Different views of the P213 unit cell of AsN (As atoms in violet and N atoms in light blue) in the ball‐stick representation mode along different crystallographic directions: [100] (A and B), [110] (C and D), one of the C 3 axis directed along [111] (E and F). The shaded polyhedra indicate the AsN3 (left) and NAs3 (right) trigonal pyramids mentioned in the text and highlighted on the top of the Figure. Data refer to AsN at 35.6 GPa and 293 K.

