FIGURE 3.

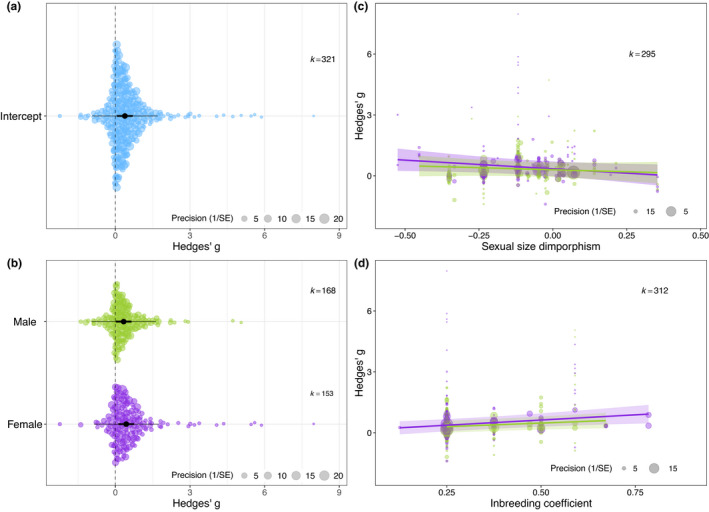
Meta‐regression means of (a) meta‐analytical mean of inbreeding depression, (b) meta‐regression of the effect of sex, (c) meta‐regression of the effect of sexual size dimorphism, and (d) meta‐regression of the effect of the inbreeding coefficient. The size of each data point represents the precision of the study (1/SE). (a) and (b) depict orchard plots where the position of the data point on the x‐axis represents the effect size value, and the position on the y‐axis is spread out randomly depending on the density of points at any given x‐value. The meta‐analytic means with 95% confidence intervals are depicted in black and the 95% prediction intervals in grey. In (c) and (d) the 95% confidence intervals of the regression lines between the inbreeding coefficient and effect size estimates are shown in a lighter colour. Males are shown in green and females in purple
