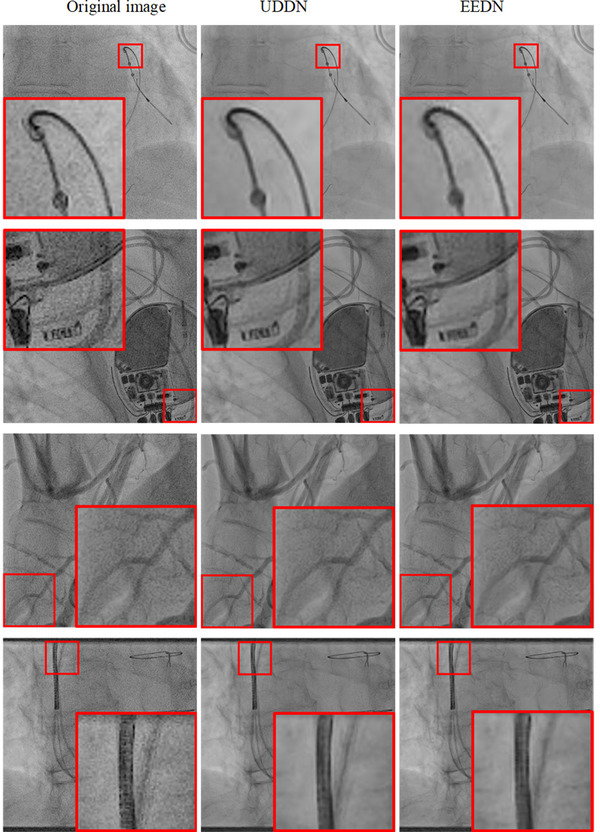
FIGURE 7.

The PSNR and SSIM comparison of denoising results on the CXR test dataset at varying input noise levels using two CNN‐based methods: UDDN 16 and the new EEDN. The number of sample images used to calculate each mean value was 30 and the error bars show the 95% confidence intervals
