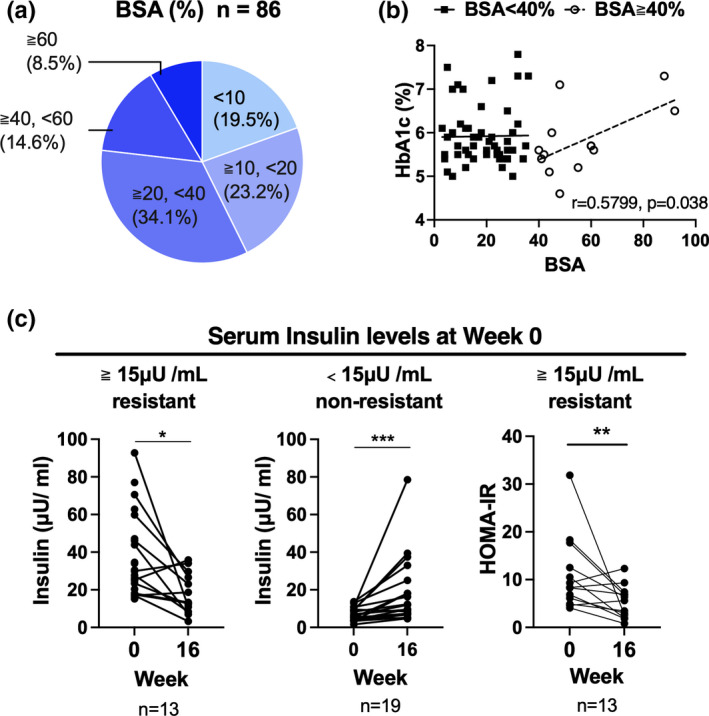
FIGURE 1.

Serum insulin levels reduced after apremilast treatment. (a) Body surface area covered by psoriatic plaques (BSA) distribution (n = 86). (b) Scatter plot of BSA and hemoglobin A1c (HbA1c) levels. In the BSA ≥ 40% group, Pearson’s r was 0.5799 (95% confidence interval, 0.04243–0.8570; n = 13). (c) Changes in the serum insulin levels or Homeostatic Model Assessment for Insulin Resistance (HOMA‐IR) after apremilast treatment (week 16) in patients whose serum insulin levels were <15 (n = 13) and ≥15 μU/mL (n = 13) at week 0. The results were analyzed using the Wilcoxon matched‐pairs signed rank test. *p < 0.05. Scatter plot of BSA and insulin levels at week 0. Pearson’s r was 0.2186 and −0.0044 in patients whose serum insulin levels were <15 (n = 35) and ≥15 μU/mL (n = 42) at week 0, respectively
