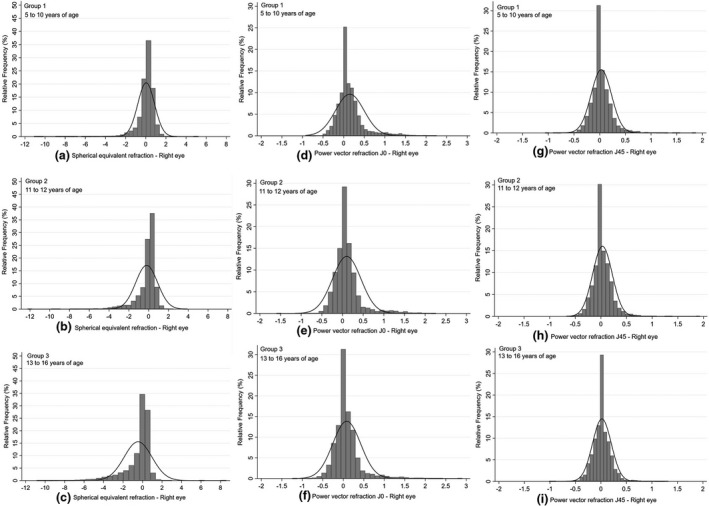
FIGURE 2.

Distribution of spherical equivalent (SE) or M values (a, b, c), J0 (d, e, f) and J45 (g, h, i) in the right eye for the three age groups of children. Group 1, ages 5–10 years (a, d, g; n = 7697); Group 2, ages 11–12 years (b, e, h; n = 2926); and Group 3, ages 13–16 years (c, f, i; n = 3719). Refraction represented in dioptres
