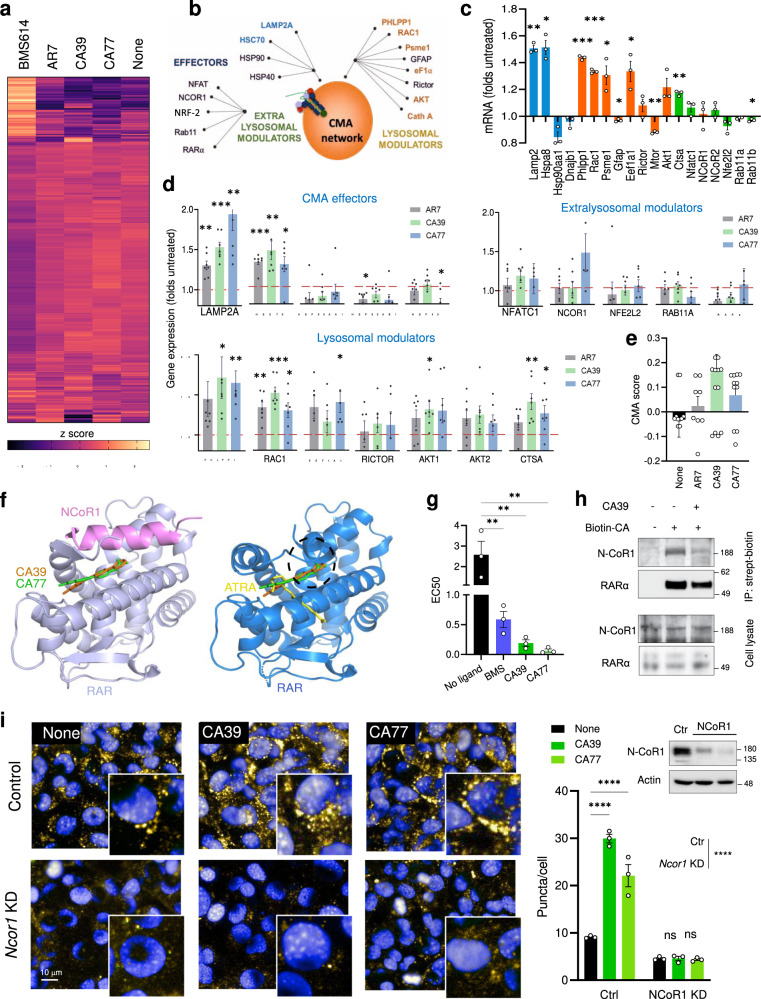
Fig. 2. CA induce discrete transcriptional changes by promoting the interaction of RARα and N-CoR1.
a Heat map of the transcriptional changes in NIH3T3 cells cultured without additions (None) or with 20μM AR7, CA39, CA77, or BMS614 for 24 h. b–d Effect of CA in components of the CMA network13 (b). Changing components highlighted in bold. c AR7-induced changes in expression of CMA network components. n = 3 different experiments. d, e mRNA levels of the CMA network components by qPCR (d) and calculated CMA activation score (e) in cells treated as in a. n = 7 independent experiments. f Molecular docking of CA39 (orange) and CA77 (green) is compatible within the inactive (left) conformation of RARα (lilac) bound to N-CoR1 peptide (pink) (PDB ID: 3KMZ). RARa active (blue) conformation is shown for comparison. ATRA (yellow) binds only to the active conformation. Hypothetical binding poses of CA39 (orange) and CA77 (green) are not compatible within the active conformation of RARα due to steric clash (black dashed circle). g EC50 (μM) in fluorescence polarization assays with RARα and the N-CoR1 peptide incubated without additions (no ligand) or in the presence of 10 μΜ of BMS394 (BMS), CA39, and CA77. n = 3 experiments. h Immunoblot for N-CoR1 and RARα of streptavidin pulldowns (top) or total cellular lysates (bottom) of NIH3T3 incubated without additions or with CA39 (10 μM) or biotin-CA (10 μM) for 24 h. IP: immunoprecipitation. This experiment was repeated 3 times. i CMA activity in NIH3T3 cells control (empty vector) or knock-down (KD) for N-CoR1 incubated without additions (none) or with 20 μM CA39 or CA77 for 24 h. Left: representative images. Nuclei are highlighted with DAPI. Inserts: higher magnification. Right: Quantification of the number of puncta per cell. n = 3 different experiments (>2,500 cells counted). Inset: immunoblot for N-CoR1. Individual values and mean + s.e.m are shown. One sample t and Wilcoxon test was used in c and d and one-way ANOVA (g) or two-way ANOVA (i) followed by Bonferroni’s multiple comparisons post-hoc test. *p < 0.05, **p < 0.01, ***p < 0.001 and ****p < 0.0001. Uncropped blots are in Supplementary Fig. 10. Source data and exact p values are provided as a Source Data file.

