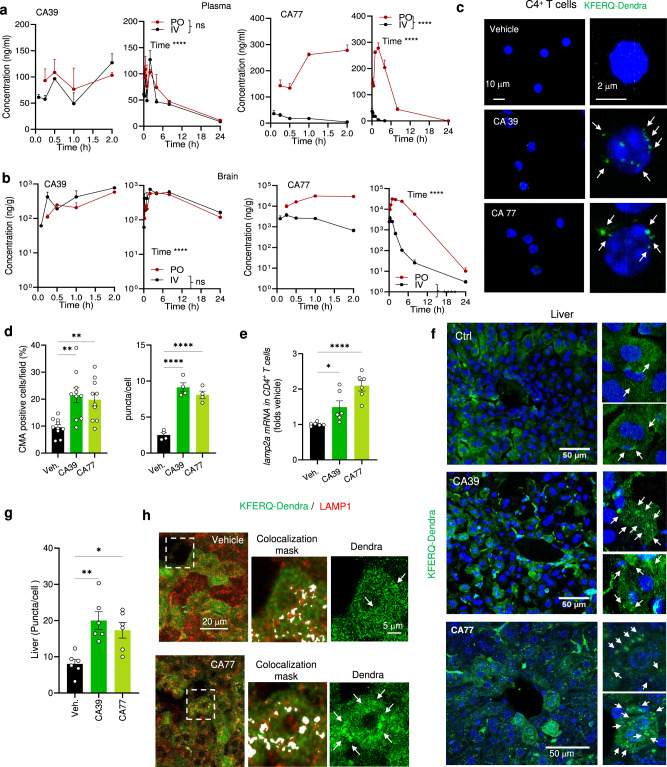
Fig. 3. CA compounds activate CMA in peripheral tissues in vivo.
a, b Levels of CA39 and CA77 at the indicated times in plasma (a) or brain (b) after p.o. (oral, 30 mg/kg bw) and i.v. (intravenous, 1 mg/kg bw) administration in mice. Graph show early (left) and late (right) time points. n = 3 mice per time point. c Direct fluorescence in CD4 + T cells isolated from blood from KFERQ-Dendra mice i.p. injected daily with (30 mg/kg bw) CA39 or CA77 for three consecutive days. Nuclei are highlighted in blue by DAPI. Right: higher magnification images. Arrows: puncta. d Percentage of CD4 + T cells with CMA puncta >3 per cell (CMA + ). n = 5 mice per condition. e mRNA levels of lamp2a in CD4 + T cells activated for 24 h in the presence of CA39 or CA77 (10 μM). Values are expressed relative to untreated cells (None) after normalization by the housekeeping gene actin. Biological triplicates from 2 independent experiments. f Representative images of livers from KFERQ-Dendra mice i.p. injected with vehicle, CA39 or CA77 as in c. Nuclei are highlighted in blue by DAPI. Insets: higher magnification of sections. Arrows: Dendra+ puncta. g Quantification of the average number of puncta per cell in liver. n = 12 sections from 4 different mice. h Representative images of liver sections from mice treated as in c with vehicle or CA77 and co-stained with LAMP1. Merged channels and higher magnification inset of merged with colocalization mask or Dendra fluorescence channel are shown. Arrows: coincidence of fluorophores in puncta. All values are mean + s.e.m. Two-way ANOVA followed by Sidak‘s multiple comparisons post-hoc test was used in (a, b), and one-way ANOVA followed by Bonferroni’s multiple comparisons post-hoc test in d, e, and g *p < 0.05, **p < 0.01 and ***p < 0.001 and ****p < 0.0001. ns: not significant. Source data and exact p values are provided as a Source Data file.

