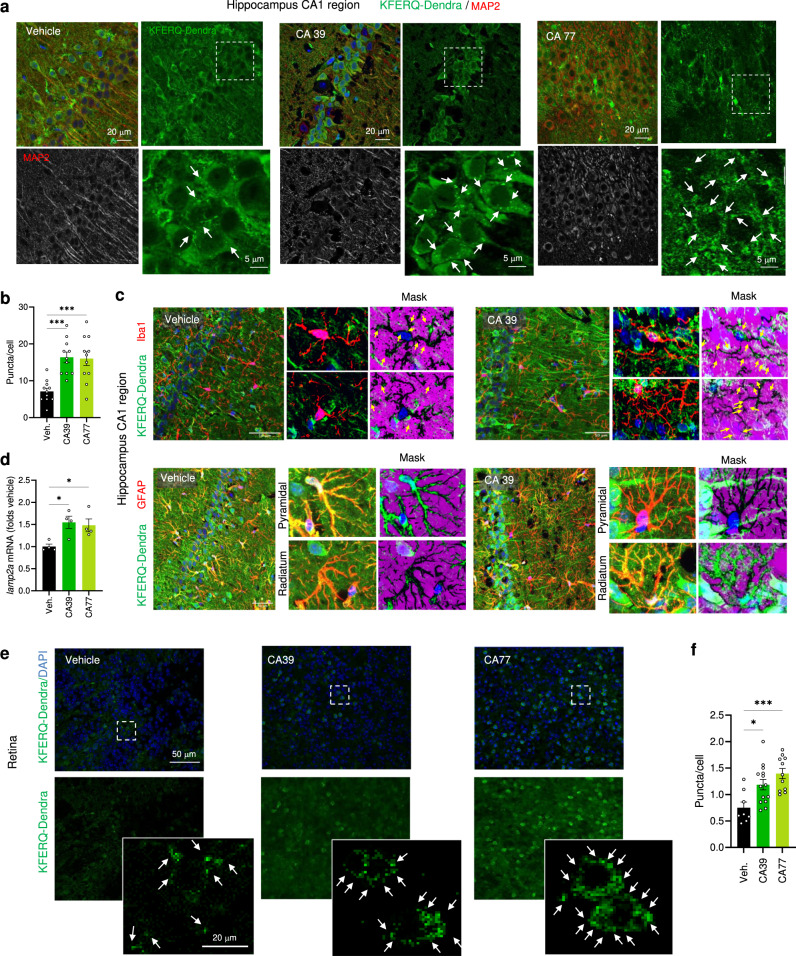
Fig. 4. CA compounds activate CMA in CNS and retina in vivo.
a Representative images of the hippocampus (CA1 region) from KFERQ-Dendra mice i.p. injected with vehicle, CA39 or CA77 daily with (30 mg/kg bw) for three consecutive days co-stained with MAP2. Merged and individual channels are shown. Inset: higher magnification of the boxed area. Arrows: Dendra+ puncta. b Quantification of the number of Dendra+ puncta per MAP2 + cell. n = 12 sections from 4 different mice. c Representative images of the hippocampus (CA1 region) from KFERQ-Dendra mice i.p. injected with vehicle or CA39 as in a co-stained with Iba1 (top) or GFAP/S100 (bottom). Merged channels are shown. Insets: higher magnification to highlight individual cells (left) and inverted mask for the Iba1 (top) or GFAP (bottom) channel to better appreciate Dendra+ puncta. d mRNA levels of lamp2a in the same brain regions as in a. n = 4 mice per condition. e Representative images of flat-mounted retinas from KFERQ-Dendra mice treated as in c. Nuclei are highlighted with DAPI on the top. Insets: higher magnification images. Arrows: Dendra+ puncta. f Quantification of the number of Dendra+ puncta per cell. n = 14 fields from 3 independent experiments. All values are mean + s.e.m. One-way ANOVA followed by Bonferroni’s multiple comparisons posthoc test was used in b, d, f. *p < 0.05 and ***p < 0.001. Source data and exact p values are provided as a Source Data file.

