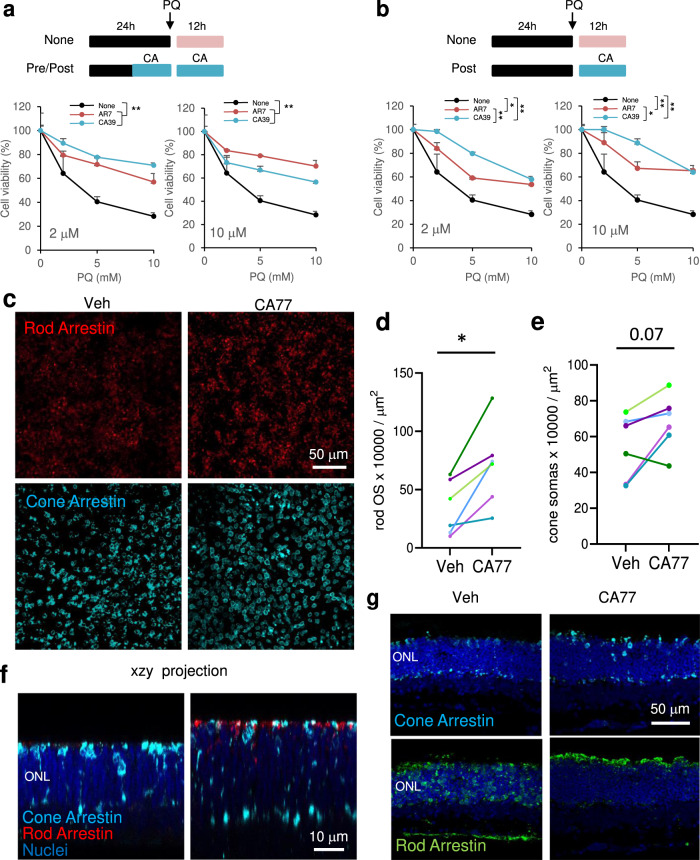
Fig. 5. CA compounds are cytoprotective in cells and tissues.
a Cell viability of NIH3T3 exposed to the indicated concentrations of paraquat (PQ) after 12 h treatment with 2 μM (left) or 10 μM (right) the indicated compounds. The treatment with PQ alone (None) or in the presence of the compounds lasted 12 h. n = 3 independent experiments. b Cell viability of NIH3T3 simultaneously exposed to the indicated concentrations of paraquat (PQ) and 2 μM (left) or 10 μM (right) of the indicated compounds for 12 h. n = 3 independent experiments. c Immunostaining for the indicated markers of rods and cones in whole-mount retinas from rd10 mice maintained without additions (right eye; Vehicle (Veh.)) or in the presence of CA77 (left eye) for 72 h. Right: Quantification of the OS stained for rod arrestin (d) or number of cone arrestin-positive somas per field (e) in retinas from the right and left eye of each animal. n = 8 mice (representative experiment from 3 independent experiments). All values are mean + s.e.m. f Orthogonal xzy projection corresponding to the areas above show from a different angle to better appreciate preserved ONL and rod and cone OS in CA77 compared to vehicle-treated mice. g Images showing staining with rod and cone arrestin in standard 12 µm-cryosections show comparable results to those obtained by whole-flat mounts. Two-way ANOVA followed by Bonferroni’s multiple comparisons posthoc test was used in a and b. Significant differences between treatments are shown in the legend and specific differences between treatment for a given PQ concentration in the figure. Data from the three independent experiments in d to compare the effect of vehicle and CA77 on arrestin OS counts or cone arrestin soma numbers, were analyzed by paired two tailed t test. *p < 0.05 and **p < 0.01. Source data and exact p values are provided as a Source Data file.

