Figure 1.

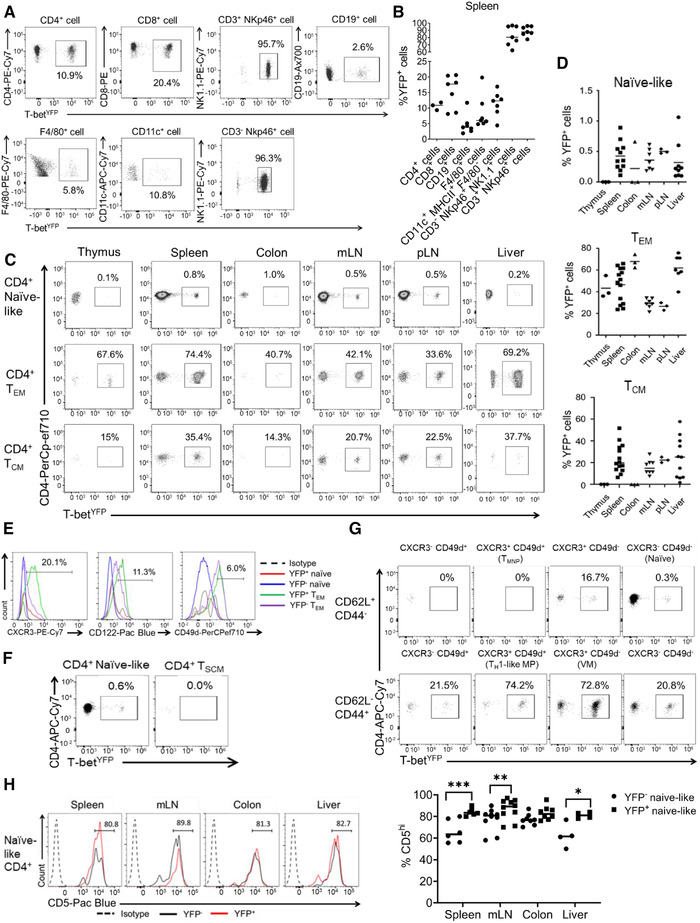
T‐bet fate mapping identifies a population of peripheral naïve‐like CD4+ T cells that have experienced T‐bet expression. (A) Representative flow plots from two independent experiments showing YFP expression in different splenic immune cells populations (n = 7 except for CD4+ T cells where n = 3). (B) Quantification of the mean proportions of YFP+ cells for each cell type shown in A (n = 7 except for CD4+ T cells where n = 3). (C) Representative flow plots from two independent experiments showing YFP expression in the naïve‐like (CD62L+ CD44– CD28+ CD27+), TCM (CD62L+ CD44+ CD28+ CD27+), and TEM (CD62L– CD44+ CD28+ CD27–) compartments in the thymus, spleen, colon, mesenteric lymph nodes, peripheral lymph nodes, and liver (n = 3 for thymus, colon, and pLN, n = 7 for mLN and liver, and n = 11 for spleen). (D) Mean proportions of YFP+ cells in the naïve, effector memory, and central memory CD4+ T‐cell populations shown in C (n = 3 for thymus, colon, and pLN, n = 7 for mLN and liver, and n = 11 for spleen). (E) Representative histograms from three independent experiments showing surface marker expression of CXCR3, CD122, CD49d in YFP– versus YFP+ naïve‐like (live CD3+ CD4+ CD62L+ CD44–) and effector memory (live CD3+ CD4+ CD62L– CD44+) CD4+ T cells from the spleen. Percentages of YFP+ naïve CD4+ T cells positive for each marker are shown (n = 16). (F) Representative flow plots from three independent experiments showing YFP expression by conventional naïve‐like CD4+ T cells (CD62L+ CD44– CD28+ CD27+ CD127+ CD122– CD95–) compared with TSCM (CD62L+ CD44– CD28+ CD27+ CD127+ CD122+ CD95+) from the spleen (n = 16). (G) Representative flow plots from three independent experiments showing YFP expression in splenic CD28+ CD27+ T‐cell populations divided by CD62L, CD44, CXCR3, and CD49d expression. Naïve (CD62L+ CD44– CXCR3– CD49d–), TMNP (CD62L+ CD44– CXCR3+ CD49d+), TH1‐like MP (CD62L– CD44+ CD49d+ CXCR3+), and VM (CD62L– CD44+ CD49d– CXCR3+) T‐cell populations are labeled (n = 16). (H) Representative histograms and mean proportions of CD5hi expressing cells from naïve‐like YFP+ CD4+ T cells (live CD3+ CD4+ CD62L+ CD44–) and naïve YFP– CD4+ T cells in the spleen, mLN, colon, and liver from two independent experiments (n = 6 for spleen and mLN, n = 10 for colon, n = 4 for liver). Percentages shown for YFP+ naïve‐like CD4+ T cells. *p < 0.05, **p < 0.01, ***p < 0.005 (Mann–Whitney U‐test).
