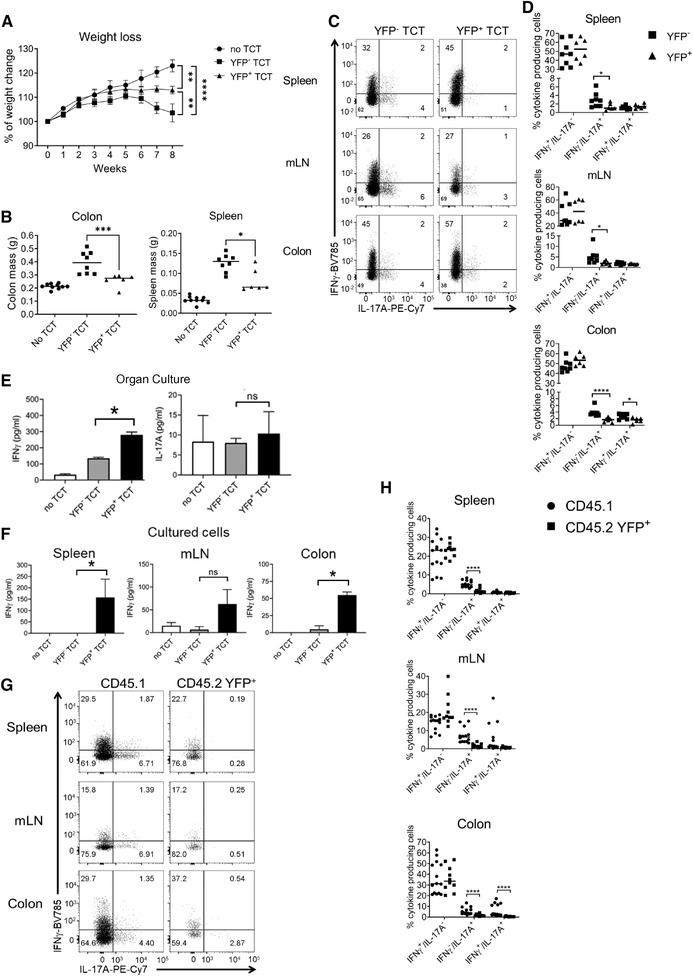
Figure 5.

YFP+ cells induce less inflammation and more IFN‐γ compared to conventional naïve CD4+ T cells after transfer to Rag2– / – mice. (A) Mean weight change from two independent experiments in Rag2–/– mice after receipt of 25,000 purified naïve‐like YFP+ or naïve YFP– CD4+ T cells, or no cell transfer control (n = 8 for YFP– transfer, n = 6 for YFP+ transfer, and n = 10 for control). ** p < 0.01, ****p < 0.0001 (Mann‐Whitney U test performed on week 8). (B) Mean spleen and colon mass in Rag2–/– mice after receipt of 25,000 purified naïve‐like YFP+ or naïve YFP– CD4+ T cells or no cell transfer control (n = 8 for YFP– transfer, n = 6 for YFP+ transfer, and n = 10 for control.) *p < 0.05, ***p < 0.005. (Kruskal–Wallis test with Dunn's corrections). (C) Representative flow plots from two independent experiments showing the proportion of YFP– and YFP+ naïve‐like CD4+ T cells that produce IFN‐γ and IL‐17A after transfer into Rag2–/– mice, separated by organ (n = 8 for YFP– transfer, n = 6 for YFP+ transfer). (D) Mean proportion of YFP– and YFP+ naïve‐like CD4+ T cells, shown in C, that produce IFN‐γ alone, IL‐17A alone, or both IFN‐γ and IL‐17A after transfer into Rag2–/– mice, separated by organ (n = 8 for YFP– transfer, n = 6 for YFP+ transfer, from two independent experiments). *p < 0.05 ****p < 0.001 (Mann‐Whitney U test). (E) Quantification of IFN‐γ and IL‐17A in the supernatant by ELISA after 48 h of colon organ culture (n = 3 experiments, each with three technical replicates, except n = 6 experiments for the no transfer control, also with three technical replicates). *p < 0.05 (Kruskal–Wallis test with Dunn's corrections). (F) Quantification of IFN‐γ and IL‐17A in the supernatant of unfractionated cell cultures from colon, spleen, and mLN (n = 3, each with three technical replicates, except n = 6 for the no transfer control, also with three technical replicates). *p < 0.05 (Kruskal–Wallis test with Dunn's corrections). (G) Representative flow plots from two independent experiments showing IFN‐γ and IL‐17A production by naïve‐like CD45.1+ and CD45.2 YFP+ CD4+ T cells after cotransfer at a ratio of 9:1 (n = 8). (H) Proportions of naïve‐like CD45.1+ and CD45.2 YFP+ CD4+ T cells producing IFN‐γ alone, IL‐17A alone, or both IFN‐γ and IL‐17A after cotransfer at a ratio of 9:1 (n = 9). ****p < 0.001 (Mann–Whitney U test).
