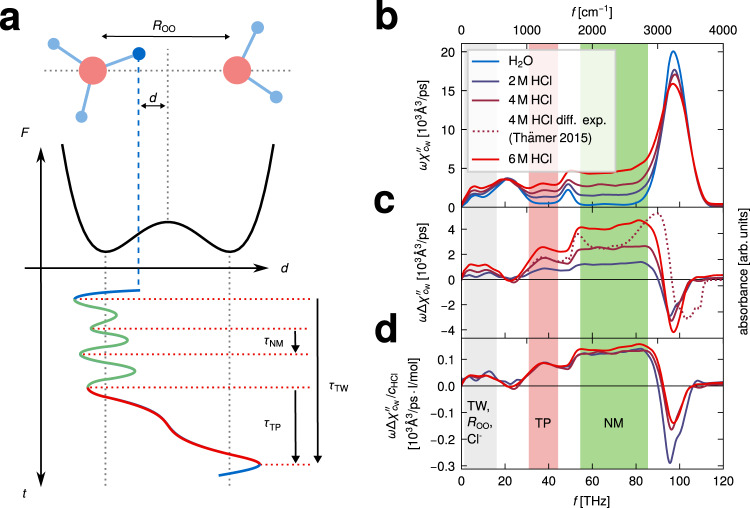
Fig. 1. Time scales of excess-proton dynamics and simulated absorption spectra.
a Schematic trajectory of an excess proton that transfers between two water molecules, together with a schematic free energy profile F(d) that exhibits a barrier and is representative of a relatively large oxygen-oxygen separation ROO. Three time scales characterize the proton trajectory, the normal-mode vibrational period of the solvated transient H3O+, τNM, the transfer-path time, τTP and the transfer-waiting time, τTW, where τTW > τTP > τNM. An animation is shown online https://fu-berlin.eu.vbrickrev.com/sharevideo/df2d94a4-6e7f-499a-a256-17d73b6124e4. b Infrared (IR) absorption spectra obtained from ab initio molecular dynamics (MD) simulations of pure water (blue solid line) and hydrochloric acid (HCl) solutions at various concentrations (dark purple: 2 M, purple: 4 and red: 6 M). The spectra are divided by the water molecular number concentration cW. c Difference spectra between the three HCl spectra and the water spectrum, obtained from the spectra in b. The purple dotted line shows an experimental difference spectrum of HCl at 4 M14, rescaled in height to match the simulation results. d The simulated difference spectra (as shown in c) divided by the HCl concentrations cHCl. Three distinct spectral regions are shaded in different colors, that are identified with different excess-proton dynamic processes: transfer waiting (TW, gray), transfer paths (TP, red), and normal modes (NM, green). The transfer-waiting time is close to the chloride-ion (Cl−) rattling time and the oxygen vibrational time in local H5O2+ complexes that is described by the ROO coordinate.

