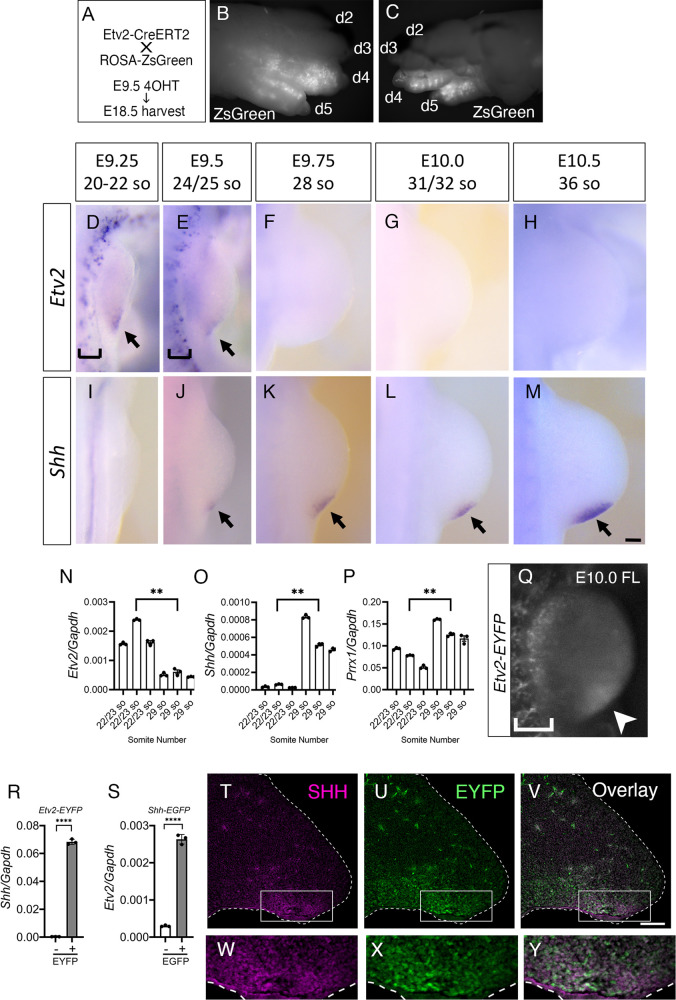
Fig. 1. Etv2 is expressed in the developing limb bud, preceding and overlapping with Shh.
A–C Breeding and pulsing scheme of this analysis (A). Whole mount epifluorescence images of dorsal (B) and ventral (C) views of a forelimb are shown. d, digit. D–M In situ hybridization of Etv2 (D-H) and Shh (I-M) at the embryonic stages indicated. Arrows in D, E, and arrows in J–M indicate Etv2 and Shh expression in forelimb buds, respectively. Brackets in D and E indicate Etv2 expression in the endothelial lineage. At least three embryos were analyzed at each stage for each marker. N–P qRT-PCR analyses of Etv2 (N), Shh (O), and Prrx1 (P) gene expression. Transcripts from forelimb buds at 22/23 somite stage (E9.25-E9.5) and 29 somite stage (E10.0), respectively from three embryos were analyzed. Sex of the embryos were not determined. Each bar represents individual embryo. Statistical test: One-way ANOVA with Tukey’s multiple comparisons test. **P-value < 0.0001 between the E9.25-E9.5 (22/23 somites) and E9.75-E10 embryos (29 somites). Q Whole-mount analysis of the developing forelimb of an E10.0 Etv2-EYFP transgenic embryo. Arrowhead points to Etv2 promoter-driven EYFP expression in the limb bud. Bracket indicates Etv2-EYFP expression in the endothelial lineage. R Shh expression in Etv2-EYFP+ cells. CD31−Tie2−Etv2-EYFP+ (gray bar) and CD31−Tie2−Etv2-EYFP- (white bar) populations were compared. Shh was enriched in the CD31−Tie2−Etv2-EYFP+ population. n = 3. Statistical test: unpaired t-test *P-value < 0.0001 between the two groups. S Etv2 expression in Shh-EGFP cells. CD31−Tie2−Shh-EGFP+ (gray bar) and CD31−Tie2−Shh-EGFP- (white bar) populations were compared. Etv2 expression was enriched in CD31−Tie2−Shh-EGFP+ population. n = 3. Statistical test: unpaired t-test. *P-value <0.0001 between the two groups. T–Y Immunohistochemistry showed overlap of SHH+ and EYFP+ cells at the posterior margin of E10.5 hindlimb buds from Etv2-EYFP transgenic embryos. A transverse section of hindlimb bud was stained with antibodies to SHH (T, W) and GFP, which detects EYFP (U, X). V and Y are overlays of T & U and W & X, respectively. Boxed regions of T–V are enlarged in W–Y. Broken lines mark the outline of the limb bud. At least three embryos were analyzed with similar results for histological analyses. Scale bars indicate 100 μm. Data in the graphs are presented as mean values + /− SEM. Source data are provided as a Source Data file.

