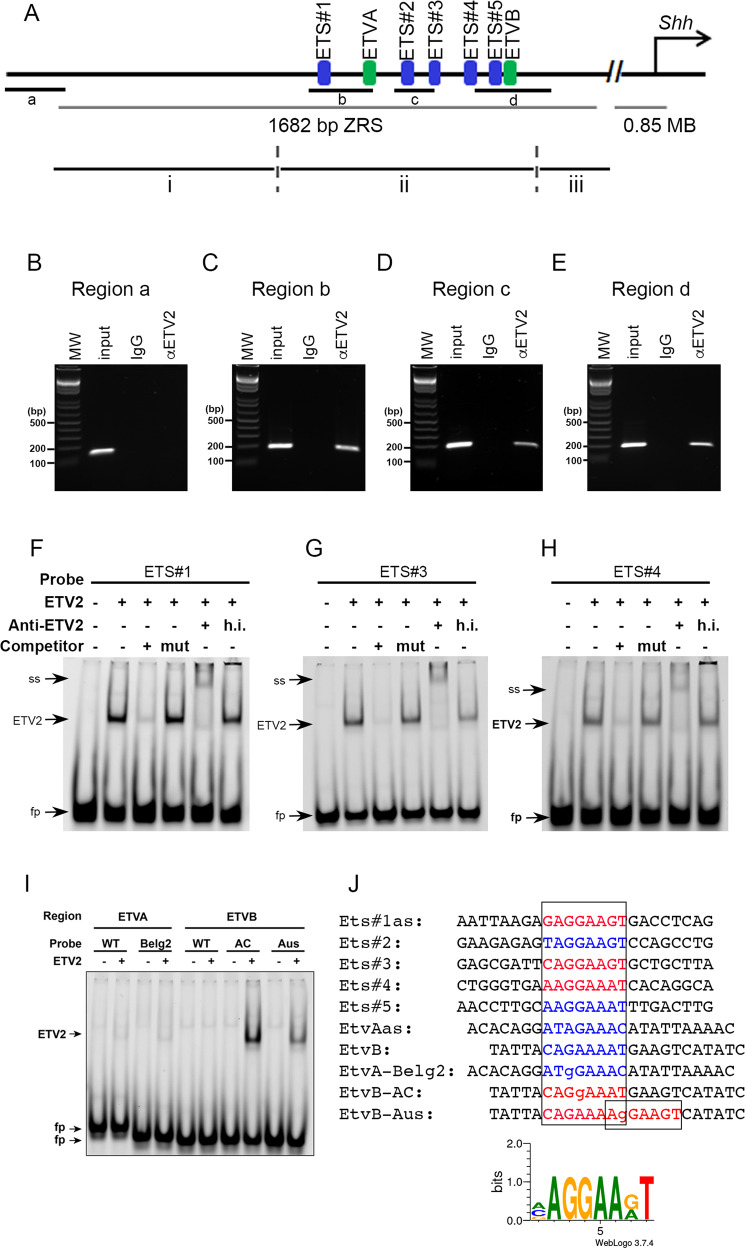
Fig. 4. ETV2 binds to the ZRS.
A A schematic of the ZRS region showing the ETS and ETV binding sites. Primers amplifying regions a, b, c, and d were used for ChIP assays. i, ii, and iii show the different regions of the ZRS region used for transcriptional activation assays. B−E ChIP assay with E10.5 hindlimb extracts. Hindlimbs from 41 wild-type embryos were pooled and dissociated. Cell extracts corresponding to 20 embryos were lysed and precipitated with an ETV2 antibody or the control IgG, respectively. Sex of the embryos were not determined. Immunoprecipitation with an ETV2 antibody shows binding of ETV2 to the regions b-d (C–E), but not to region a, which is located outside of the ZRS region (B). Input, input DNA without immunoprecipitation (positive control); IgG, Immunoprecipitation with control IgG; αETV2, immunoprecipitation with antibody against ETV2. Note that regions a-d were not amplified when pulled down with control IgG, while when pulled down with αETV2, regions b, c, and d were amplified. ChIP was repeated four times with pooled hindlimb buds from 10 to 20 embryos each with essentially the same results. F–H EMSA using three different probes representing Ets#1, #3 and #4 binding sites each show strong binding of ETV2 protein. Note that each of the specific band in F–H is competed by a corresponding wild-type competitor (3rd lane from the left, respectively) but not by a competitor with respective binding site mutated (4th lane). Specificity is further confirmed by supershifting by ETV2 antibody (5th lane), but not by a heat-inactivated antibody (6th lane, h.i.). I EMSA using ETVA and ETVB probes. No binding was observed with the wild-type sequences (WT). The AC and Aus mutations of the ETVB sequence bound ETV2, while the Belg2 mutation of ETVA sequence did not. J Alignment of probes used for EMSA. Red letters indicate the sequences bound by ETV2 and blue letters indicate sequences that were not. Alignment of the sequences recognized by ETV2 is shown by the graphical representation at the bottom. Each experiment was repeated at least three times with similar results. Source data are provided as a Source Data file.

